Mouse brain microglia stGP tutorial
This notebook follows the MouseBrain MERFISH Microglia analysis step by step: load the processed cells, build the temporal/spatial kernels, fit stGP, write Results/stgp/Microglia, and regenerate source figures under Figures/Microglia.
The helper module utils.py keeps path/I/O/repeated helper code out of the notebook. The main analysis decisions stay visible in the cells below.
[1]:
%matplotlib inline
import os
import pickle
import sys
from pathlib import Path
import matplotlib.pyplot as plt
import numpy as np
import pandas as pd
import scanpy as sc
from IPython.display import display

PROJECT_DIR = Path.cwd()
os.chdir(PROJECT_DIR)
sys.path.insert(0, str(PROJECT_DIR))
sys.path.insert(0, str(PROJECT_DIR.parent))

from stgp.estimation import fit_pfactor, fit_pfactor_auto
from stgp.kernels import (
    bandwidth_select_spatial,
    bandwidth_select_temporal,
    build_K_age,
    build_K_spa_list_from_stacked,
)
from stgp.preprocessing import log1p_norm_centered_list, standardize_coords_list
import utils
from plots import set_nature_style
set_nature_style()
[2]:
CELLTYPE = "Microglia"
SEED = 0

safe_ct = utils.safe_name(CELLTYPE)
input_h5ad = utils.DATA_PROCESSED / f"{safe_ct}.h5ad"
stgp_dir = utils.RESULTS_STGP / safe_ct
fig_dir = utils.FIGURES_ROOT / safe_ct
stgp_dir.mkdir(parents=True, exist_ok=True)
fig_dir.mkdir(parents=True, exist_ok=True)
stgp_pkl = stgp_dir / "stgp_result.pkl"
scored_h5ad = stgp_dir / "adata_with_scores.h5ad"
W_csv = stgp_dir / "W.csv"
1. Load cells and organize slices
stGP is fit to one target cell type. Cells are grouped by mouse_id; each mouse contributes one age and one spatial kernel block.
[3]:
adata = sc.read_h5ad(str(input_h5ad))
age_arr = adata.obs["age"].to_numpy(dtype=float)
groups = adata.obs["mouse_id"].astype(str).to_numpy()
uniq_mice, inv = np.unique(groups, return_inverse=True)
idx_per_group = [np.sort(np.where(inv == t)[0]) for t in range(len(uniq_mice))]
nlist = np.array([len(ix) for ix in idx_per_group])
ages = np.array([age_arr[ix[0]] for ix in idx_per_group])

summary = pd.DataFrame({"mouse_id": uniq_mice, "age": ages, "n_cells": nlist})
print(f"Loaded {adata.n_obs:,} {CELLTYPE} cells and {adata.n_vars:,} genes.")
summary.head()
Loaded 52,417 Microglia cells and 220 genes.
[3]:
| mouse_id | age | n_cells | |
|---|---|---|---|
| 0 | 1 | 3.8 | 2543 |
| 1 | 101 | 34.5 | 2518 |
| 2 | 11 | 9.8 | 2390 |
| 3 | 14 | 12.9 | 2789 |
| 4 | 19 | 15.5 | 2258 |
2. Build expression, temporal, and spatial inputs
The expression matrix is split by mouse, log-normalized/centered, and paired with an age kernel plus one spatial kernel per mouse slice.
[4]:
X_raw = np.asarray(adata.X)
Y_list, _ = log1p_norm_centered_list([X_raw[ix] for ix in idx_per_group])
coords_list = standardize_coords_list([adata.obsm["spatial"][ix] for ix in idx_per_group])
gamma_spa = bandwidth_select_spatial(coords_list, frac=0.01, rho=0.75)
gamma_age = bandwidth_select_temporal(ages, rho=np.exp(-4))
K_age = build_K_age(ages, gamma_age, kernel="rbf", standardize=True)
K_spa_list = build_K_spa_list_from_stacked(
    np.vstack(coords_list), nlist, gamma_spa, standardize=False, jitter=1e-6,
)
print(f"gamma_spa = {gamma_spa:.4f}")
print(f"gamma_age = {gamma_age:.4f}")
print(f"K_age shape: {K_age.shape}")
print(f"Spatial kernel blocks: {len(K_spa_list)}")
gamma_spa = 0.1820
gamma_age = 0.2851
K_age shape: (20, 20)
Spatial kernel blocks: 20
3. Fit stGP
[5]:
res = fit_pfactor_auto(
    Y_list=Y_list, Nlist=nlist, K_age=K_age, Kspa_list=K_spa_list,
    p_max=10, k=15,
    inner_rank1_tol=1e-4, rel_improve_total_tol=0.005, backfit_tol=1e-4, prune_energy_frac = 0.01,
    random_state=0, verbose=1,
)
print(f"Selected programs: {res['W'].shape[0]}")
[sweep=001] dW_rel=2.047e-01 dTheta_rel=1.315e-01 time=1.595e+01
[sweep=002] dW_rel=9.816e-02 dTheta_rel=6.081e-02 time=2.022e+01
[sweep=003] dW_rel=1.052e-01 dTheta_rel=2.388e-01 time=1.590e+01
[sweep=004] dW_rel=1.052e-01 dTheta_rel=2.918e-02 time=1.214e+01
[sweep=005] dW_rel=3.549e-02 dTheta_rel=1.988e-02 time=8.170e+00
[sweep=006] dW_rel=2.205e-02 dTheta_rel=8.252e-03 time=9.000e+00
[sweep=007] dW_rel=7.226e-02 dTheta_rel=6.367e-03 time=1.001e+01
[sweep=008] dW_rel=7.477e-02 dTheta_rel=6.201e-03 time=8.625e+00
[sweep=009] dW_rel=4.475e-02 dTheta_rel=7.702e-03 time=7.681e+00
[sweep=010] dW_rel=7.318e-02 dTheta_rel=6.358e-03 time=1.046e+01
[sweep=011] dW_rel=2.598e-02 dTheta_rel=4.430e-03 time=8.434e+00
[sweep=012] dW_rel=4.757e-02 dTheta_rel=2.727e-03 time=7.037e+00
[sweep=013] dW_rel=1.031e-02 dTheta_rel=1.259e-03 time=4.098e+00
[sweep=014] dW_rel=7.490e-03 dTheta_rel=9.060e-04 time=3.910e+00
[sweep=015] dW_rel=5.734e-03 dTheta_rel=7.409e-04 time=3.865e+00
[sweep=016] dW_rel=4.608e-03 dTheta_rel=5.881e-04 time=3.882e+00
[sweep=017] dW_rel=3.838e-03 dTheta_rel=4.566e-04 time=3.581e+00
[sweep=018] dW_rel=3.279e-03 dTheta_rel=3.585e-04 time=3.363e+00
[sweep=019] dW_rel=2.841e-03 dTheta_rel=2.780e-04 time=3.063e+00
[sweep=020] dW_rel=2.485e-03 dTheta_rel=2.215e-04 time=2.898e+00
[sweep=021] dW_rel=2.179e-03 dTheta_rel=1.730e-04 time=2.558e+00
[sweep=022] dW_rel=1.909e-03 dTheta_rel=1.413e-04 time=2.343e+00
[sweep=023] dW_rel=1.674e-03 dTheta_rel=1.181e-04 time=2.190e+00
[sweep=024] dW_rel=1.463e-03 dTheta_rel=9.263e-05 time=1.888e+00
[sweep=025] dW_rel=1.280e-03 dTheta_rel=8.448e-05 time=1.935e+00
[sweep=026] dW_rel=1.117e-03 dTheta_rel=6.949e-05 time=1.778e+00
[sweep=027] dW_rel=9.649e-04 dTheta_rel=5.161e-05 time=1.495e+00
[sweep=028] dW_rel=8.408e-04 dTheta_rel=4.677e-05 time=1.434e+00
[sweep=029] dW_rel=7.303e-04 dTheta_rel=7.305e-05 time=1.837e+00
[sweep=030] dW_rel=6.328e-04 dTheta_rel=3.711e-05 time=1.501e+00
[sweep=031] dW_rel=5.475e-04 dTheta_rel=3.305e-05 time=1.432e+00
[sweep=032] dW_rel=4.725e-04 dTheta_rel=2.666e-05 time=1.343e+00
[sweep=033] dW_rel=4.002e-04 dTheta_rel=2.420e-05 time=1.256e+00
[sweep=034] dW_rel=3.464e-04 dTheta_rel=2.204e-05 time=1.245e+00
[sweep=035] dW_rel=2.987e-04 dTheta_rel=2.004e-05 time=1.245e+00
[sweep=036] dW_rel=2.573e-04 dTheta_rel=1.822e-05 time=1.240e+00
[sweep=037] dW_rel=2.213e-04 dTheta_rel=1.442e-05 time=1.192e+00
[sweep=038] dW_rel=1.904e-04 dTheta_rel=1.438e-05 time=1.193e+00
[sweep=039] dW_rel=1.637e-04 dTheta_rel=1.358e-05 time=1.197e+00
[sweep=040] dW_rel=1.407e-04 dTheta_rel=1.262e-05 time=1.259e+00
[sweep=041] dW_rel=1.209e-04 dTheta_rel=1.166e-05 time=1.193e+00
[sweep=042] dW_rel=1.038e-04 dTheta_rel=1.074e-05 time=1.231e+00
[auto_rank prune] p=5 -> 4 (dropped factors [4])
[sweep=001] dW_rel=2.050e-01 dTheta_rel=1.935e-02 time=7.304e+00
[sweep=002] dW_rel=4.508e-02 dTheta_rel=1.378e-02 time=9.061e+00
[sweep=003] dW_rel=6.436e-02 dTheta_rel=9.815e-03 time=8.215e+00
[sweep=004] dW_rel=7.025e-02 dTheta_rel=8.709e-03 time=6.727e+00
[sweep=005] dW_rel=1.094e-01 dTheta_rel=7.809e-03 time=6.202e+00
[sweep=006] dW_rel=2.982e-02 dTheta_rel=5.114e-03 time=6.516e+00
[sweep=007] dW_rel=1.268e-02 dTheta_rel=2.874e-03 time=4.880e+00
[sweep=008] dW_rel=8.554e-03 dTheta_rel=1.743e-03 time=4.580e+00
[sweep=009] dW_rel=6.536e-03 dTheta_rel=1.223e-03 time=4.084e+00
[sweep=010] dW_rel=5.272e-03 dTheta_rel=9.909e-04 time=3.667e+00
[sweep=011] dW_rel=4.360e-03 dTheta_rel=8.529e-04 time=3.194e+00
[sweep=012] dW_rel=3.654e-03 dTheta_rel=7.272e-04 time=2.775e+00
[sweep=013] dW_rel=3.087e-03 dTheta_rel=6.172e-04 time=2.575e+00
[sweep=014] dW_rel=2.626e-03 dTheta_rel=5.281e-04 time=2.520e+00
[sweep=015] dW_rel=2.246e-03 dTheta_rel=4.451e-04 time=2.383e+00
[sweep=016] dW_rel=1.930e-03 dTheta_rel=3.789e-04 time=2.316e+00
[sweep=017] dW_rel=1.664e-03 dTheta_rel=3.233e-04 time=2.208e+00
[sweep=018] dW_rel=1.440e-03 dTheta_rel=2.789e-04 time=2.140e+00
[sweep=019] dW_rel=1.248e-03 dTheta_rel=2.353e-04 time=1.996e+00
[sweep=020] dW_rel=1.083e-03 dTheta_rel=2.065e-04 time=2.016e+00
[sweep=021] dW_rel=9.415e-04 dTheta_rel=1.769e-04 time=1.854e+00
[sweep=022] dW_rel=8.232e-04 dTheta_rel=1.545e-04 time=1.807e+00
[sweep=023] dW_rel=7.161e-04 dTheta_rel=1.415e-04 time=1.863e+00
[sweep=024] dW_rel=6.204e-04 dTheta_rel=1.201e-04 time=1.712e+00
[sweep=025] dW_rel=5.386e-04 dTheta_rel=1.041e-04 time=1.613e+00
[sweep=026] dW_rel=4.682e-04 dTheta_rel=9.345e-05 time=1.581e+00
[sweep=027] dW_rel=4.044e-04 dTheta_rel=7.754e-05 time=1.438e+00
[sweep=028] dW_rel=3.497e-04 dTheta_rel=7.096e-05 time=1.389e+00
[sweep=029] dW_rel=3.039e-04 dTheta_rel=5.903e-05 time=1.303e+00
[sweep=030] dW_rel=2.592e-04 dTheta_rel=5.055e-05 time=1.271e+00
[sweep=031] dW_rel=2.262e-04 dTheta_rel=4.416e-05 time=1.153e+00
[sweep=032] dW_rel=1.966e-04 dTheta_rel=4.191e-05 time=1.146e+00
[sweep=033] dW_rel=1.607e-04 dTheta_rel=3.047e-05 time=1.006e+00
[sweep=034] dW_rel=1.453e-04 dTheta_rel=2.944e-05 time=1.010e+00
[sweep=035] dW_rel=1.224e-04 dTheta_rel=2.448e-05 time=9.691e-01
[sweep=036] dW_rel=1.072e-04 dTheta_rel=2.320e-05 time=9.626e-01
Selected programs: 4
[6]:
stgp_res = fit_pfactor(
    Y_list, nlist, K_age, K_spa_list,
    p=4, k=15, verbose=1,
)
[sweep=001] dW_rel=3.340e-01 dTheta_rel=2.746e-01 time=1.382e+01
[sweep=002] dW_rel=1.542e-01 dTheta_rel=4.578e-01 time=1.977e+01
[sweep=003] dW_rel=2.119e-01 dTheta_rel=4.417e-01 time=8.497e+00
[sweep=004] dW_rel=6.282e-02 dTheta_rel=4.799e-03 time=2.933e+00
[sweep=005] dW_rel=2.031e-02 dTheta_rel=3.977e-03 time=3.023e+00
[sweep=006] dW_rel=1.611e-02 dTheta_rel=3.336e-03 time=2.879e+00
[sweep=007] dW_rel=1.302e-02 dTheta_rel=2.805e-03 time=2.752e+00
[sweep=008] dW_rel=1.059e-02 dTheta_rel=2.290e-03 time=2.580e+00
[sweep=009] dW_rel=8.649e-03 dTheta_rel=1.900e-03 time=2.454e+00
[sweep=010] dW_rel=7.088e-03 dTheta_rel=1.567e-03 time=2.391e+00
[sweep=011] dW_rel=5.821e-03 dTheta_rel=1.238e-03 time=2.079e+00
[sweep=012] dW_rel=4.793e-03 dTheta_rel=1.102e-03 time=2.076e+00
[sweep=013] dW_rel=5.727e-02 dTheta_rel=1.478e-03 time=2.020e+00
[sweep=014] dW_rel=6.727e-02 dTheta_rel=4.087e-03 time=3.080e+00
[sweep=015] dW_rel=1.665e-02 dTheta_rel=5.133e-03 time=3.520e+00
[sweep=016] dW_rel=6.557e-02 dTheta_rel=4.990e-03 time=3.061e+00
[sweep=017] dW_rel=3.980e-02 dTheta_rel=6.455e-03 time=2.881e+00
[sweep=018] dW_rel=3.250e-02 dTheta_rel=5.115e-03 time=2.794e+00
[sweep=019] dW_rel=2.522e-02 dTheta_rel=3.717e-03 time=2.426e+00
[sweep=020] dW_rel=1.967e-02 dTheta_rel=2.649e-03 time=2.205e+00
[sweep=021] dW_rel=1.548e-02 dTheta_rel=1.841e-03 time=1.959e+00
[sweep=022] dW_rel=6.930e-02 dTheta_rel=2.444e-03 time=2.269e+00
[sweep=023] dW_rel=1.052e-02 dTheta_rel=1.510e-03 time=1.927e+00
[sweep=024] dW_rel=8.528e-03 dTheta_rel=8.912e-04 time=1.564e+00
[sweep=025] dW_rel=6.973e-03 dTheta_rel=6.576e-04 time=1.548e+00
[sweep=026] dW_rel=5.751e-03 dTheta_rel=4.357e-04 time=1.295e+00
[sweep=027] dW_rel=4.775e-03 dTheta_rel=3.932e-04 time=1.311e+00
[sweep=028] dW_rel=3.958e-03 dTheta_rel=2.879e-04 time=1.210e+00
[sweep=029] dW_rel=3.317e-03 dTheta_rel=2.621e-04 time=1.189e+00
[sweep=030] dW_rel=2.788e-03 dTheta_rel=2.563e-04 time=1.288e+00
[sweep=031] dW_rel=2.356e-03 dTheta_rel=1.958e-04 time=1.140e+00
[sweep=032] dW_rel=1.997e-03 dTheta_rel=1.816e-04 time=1.142e+00
[sweep=033] dW_rel=1.697e-03 dTheta_rel=1.652e-04 time=1.193e+00
[sweep=034] dW_rel=1.445e-03 dTheta_rel=1.487e-04 time=1.156e+00
[sweep=035] dW_rel=1.233e-03 dTheta_rel=1.331e-04 time=1.150e+00
[sweep=036] dW_rel=1.054e-03 dTheta_rel=1.186e-04 time=1.152e+00
4. Write stGP outputs
Scores H and spatial residuals b are mapped back to original cell order and saved in obsm['X_stgp'] and obsm['X_stgp_spatial'].
[7]:
stgp_res["gamma_age"] = gamma_age
stgp_res["gamma_spa"] = gamma_spa
with open(stgp_pkl, "wb") as f:
    pickle.dump(stgp_res, f)

p_sel = stgp_res["W"].shape[0]
prog_labels = [f"stGP{j + 1}" for j in range(p_sel)]
W = pd.DataFrame(stgp_res["W"], index=prog_labels, columns=adata.var_names)
W.to_csv(W_csv)

all_idx = np.concatenate(idx_per_group)
H_adata = np.empty_like(stgp_res["H"])
H_adata[all_idx] = stgp_res["H"]
b_adata = np.empty_like(stgp_res["b"])
b_adata[all_idx] = stgp_res["b"]
adata.obsm["X_stgp"] = H_adata.astype(np.float32)
adata.obsm["X_stgp_spatial"] = b_adata.astype(np.float32)

alpha_arr = np.asarray(stgp_res.get("alpha", []))
alpha_lower_arr = np.asarray(stgp_res.get("alpha_lower", []))
alpha_upper_arr = np.asarray(stgp_res.get("alpha_upper", []))
adata.uns["stgp"] = dict(
    groups=uniq_mice.tolist(), ages=ages.tolist(),
    gamma_age=gamma_age, gamma_spa=gamma_spa, p_selected=p_sel,
    alpha=alpha_arr.tolist() if alpha_arr.ndim == 2 else [],
    alpha_lower=alpha_lower_arr.tolist() if alpha_lower_arr.ndim == 2 else [],
    alpha_upper=alpha_upper_arr.tolist() if alpha_upper_arr.ndim == 2 else [],
)
adata.write_h5ad(scored_h5ad, compression="gzip")
[8]:
methods = utils._load_methods(safe_ct, CELLTYPE, stgp_dir=stgp_dir)
stgp_method = next((m for m in methods if m.method == "stGP"), None)
stgp_res = utils._load_stgp_pickle(safe_ct, stgp_dir=stgp_dir) if stgp_method is not None else None
stamp_m = next((m for m in methods if m.method == "STAMP"), None)
method_table = pd.DataFrame([
    {
        "method": m.method,
        "cells": m.adata.n_obs,
        "programs": m.scores.shape[1],
        "has_gene_weights": m.gene_weights is not None,
        "result_dir": str(m.result_dir),
    }
    for m in methods
])
  [loaded] stGP: (52417, 4)
  [skip] SpatialPCA: result dir not found
  [skip] MEFISTO: result dir not found
  [skip] STAMP: result dir not found
  [skip] Popari: result dir not found
[9]:
from plots import plot_program_variance_partition, save_pair

stgp = stgp_method
info = stgp.adata.uns.get("stgp", {})
prog_names = stgp.scores.columns.astype(str).tolist()
idx = prog_names.index("stGP2") if "stGP2" in prog_names else 1
ages = np.asarray(info["ages"], dtype=float)
alpha = np.asarray(info["alpha"], dtype=float)
lo = np.asarray(info.get("alpha_lower", []), dtype=float)
hi = np.asarray(info.get("alpha_upper", []), dtype=float)
order = np.argsort(ages)
fig, ax = plt.subplots(figsize=(6.5, 5.05), constrained_layout=True)
if lo.shape == alpha.shape and hi.shape == alpha.shape:
    ax.fill_between(ages[order], lo[idx, order], hi[idx, order], color="#2C7FB8", alpha=0.18, linewidth=0, label="95% posterior CI")
    ax.plot(ages[order], lo[idx, order], color="#2C7FB8", lw=1.4, ls="--", alpha=0.65)
    ax.plot(ages[order], hi[idx, order], color="#2C7FB8", lw=1.4, ls="--", alpha=0.65)
ax.plot(ages[order], alpha[idx, order], color="#2C7FB8", lw=3.0)
ax.scatter(ages[order], alpha[idx, order], color="#2C7FB8", s=72, zorder=3, label="Posterior mean")
ax.axhline(0, color="#8A8A8A", lw=1.0, ls=":")
ax.set_xlabel("Age (months)", fontsize=24)
ax.set_ylabel(r"Aging effect $\alpha$", fontsize=24)
ax.tick_params(axis="both", labelsize=20, length=4.5, width=1.1)
ax.legend(fontsize=20, loc="best")
save_pair(fig, "Microglia_stGP_stGP2_alpha_over_age", fig_dir)
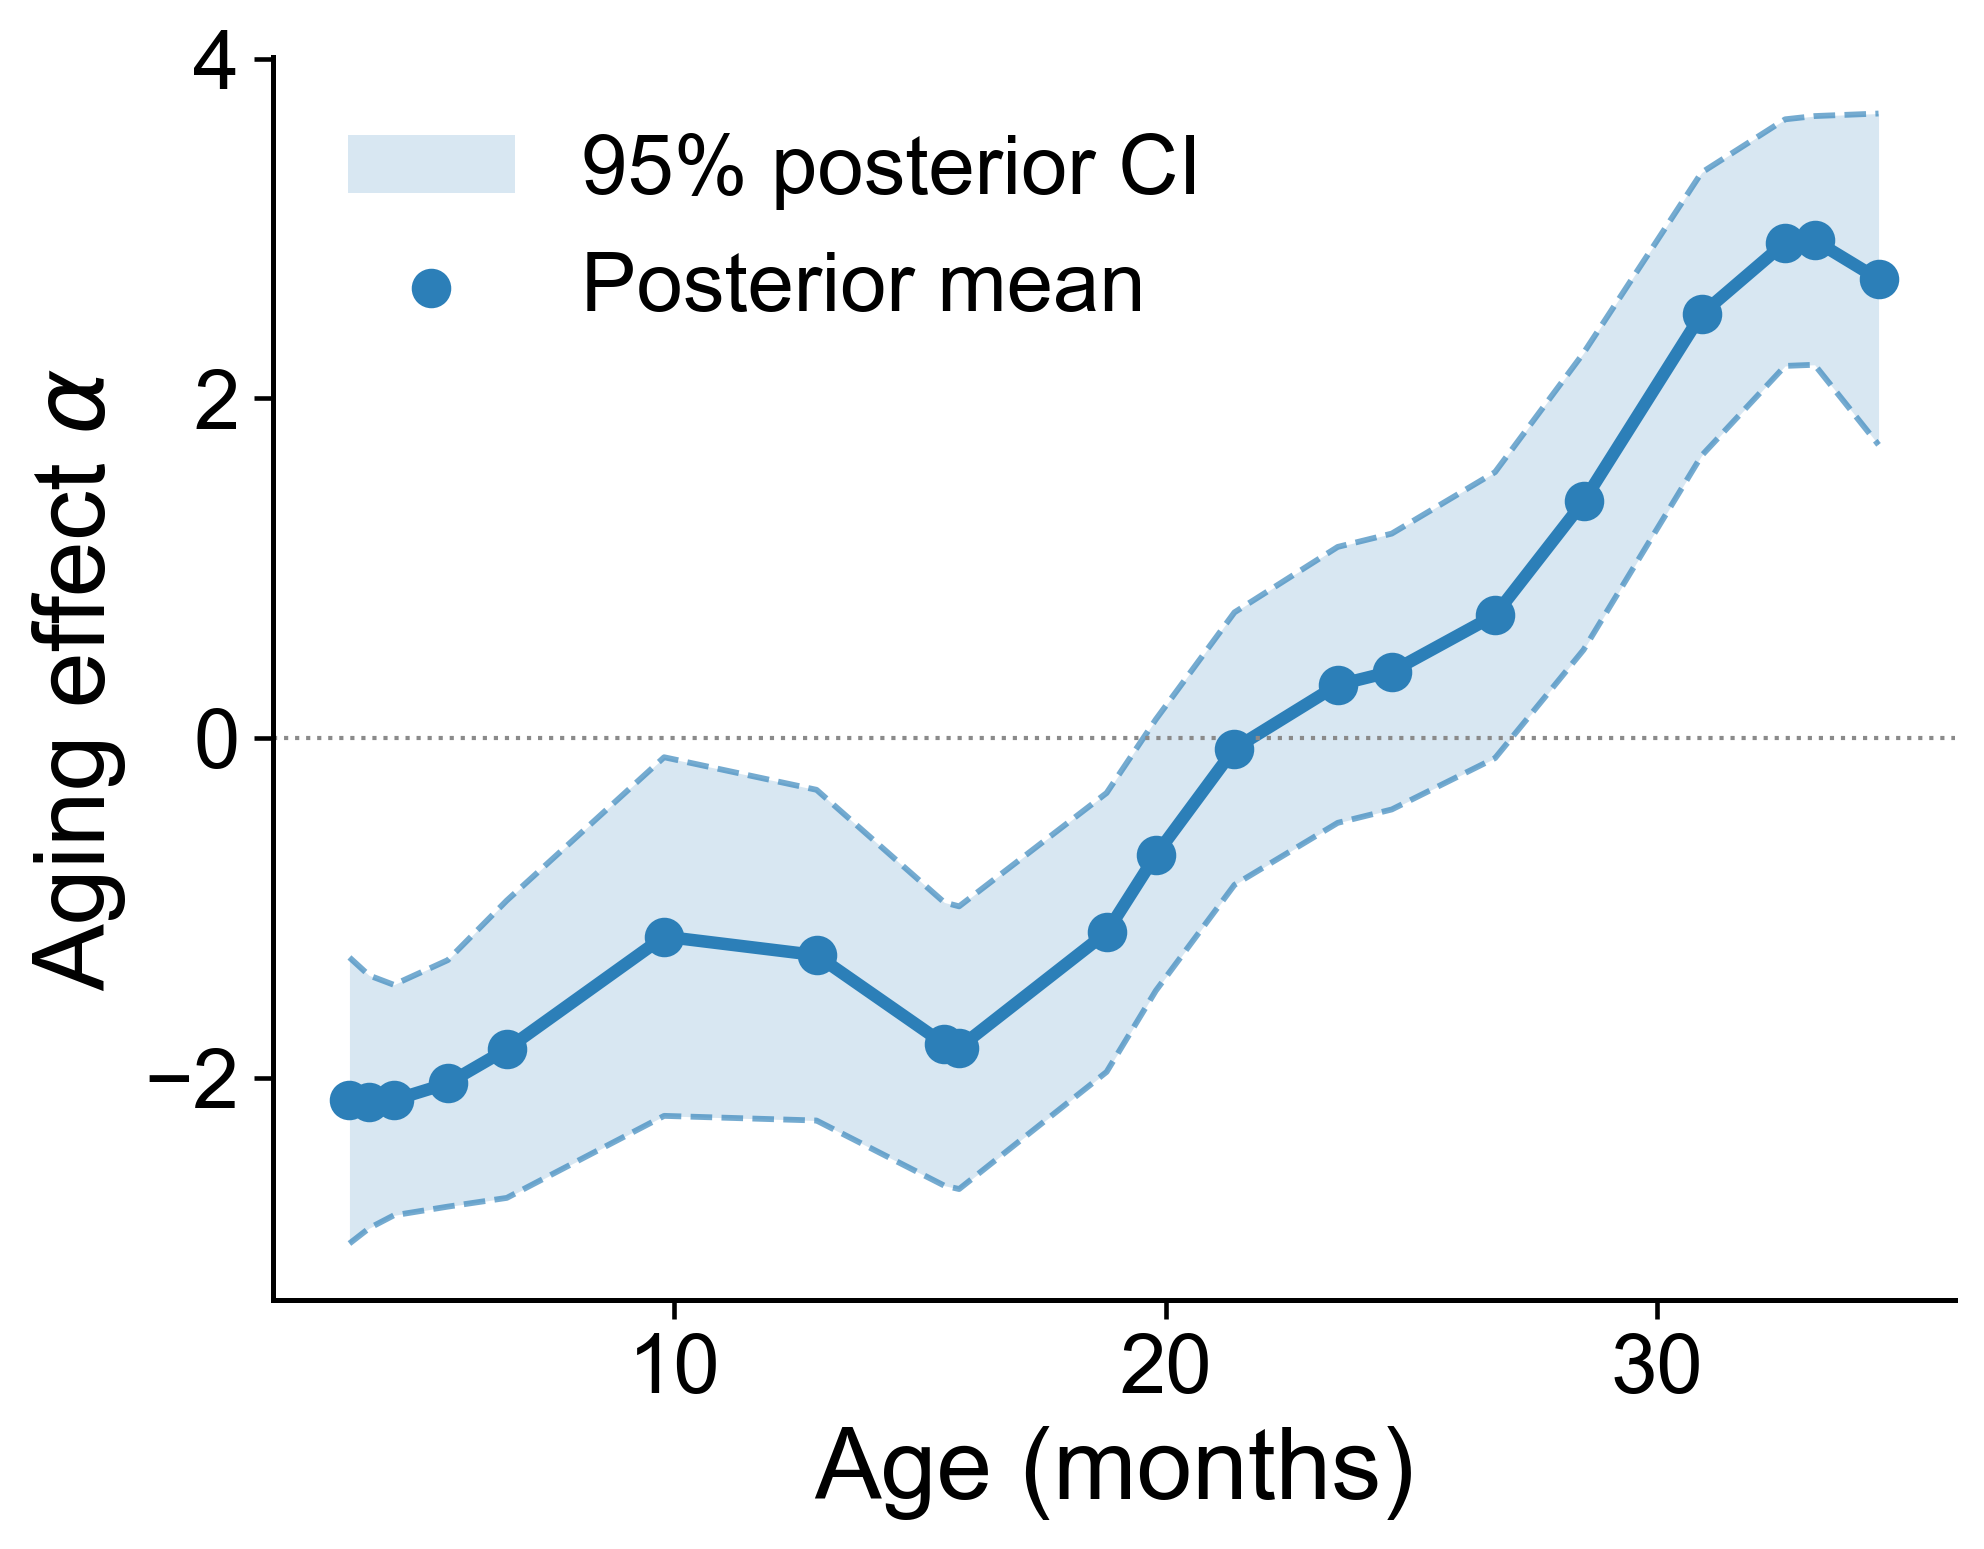
[9]:
(PosixPath('Figures/Microglia/Microglia_stGP_stGP2_alpha_over_age.png'),
 PosixPath('Figures/Microglia/Microglia_stGP_stGP2_alpha_over_age.pdf'))
[10]:
stgp_vdf = utils._section1_variance_decomposition(
    stgp_method, stgp_res, celltype=CELLTYPE, safe_ct=safe_ct, fig_dir=fig_dir,
)
utils._section2_program_scores_by_age(
    stgp_method, stgp_vdf, celltype=CELLTYPE, safe_ct=safe_ct, fig_dir=fig_dir,
)
  [fig] Variance decomposition (stGP) ...
  [fig] Program weighted scores by age ...
  [fig] Active-gene dot plots ...
[11]:
fig = plot_program_variance_partition(stgp_vdf, title="Variance explained (%)")
save_pair(fig, "Microglia_stGP_variance_partition", fig_dir)

[11]:
(PosixPath('Figures/Microglia/Microglia_stGP_variance_partition.png'),
 PosixPath('Figures/Microglia/Microglia_stGP_variance_partition.pdf'))
4. Spatial program maps
This section writes spatial maps, age-ordered stack plots, and benchmark comparisons.
[12]:
utils._section4_spatial_maps_and_clustering(
    methods, stgp_method, celltype=CELLTYPE, safe_ct=safe_ct, fig_dir=fig_dir,
)
utils._section5_program_similarity(
    methods, stgp_method, celltype=CELLTYPE, safe_ct=safe_ct, fig_dir=fig_dir,
)
spatial_outputs = sorted((fig_dir / "spatial_selected_2x2").rglob("*.png"))
sim_outputs = sorted((fig_dir / "program_similarity").rglob("*.csv"))
[fig] Spatial program maps + KNN spectral domains ...
/import/home4/byual/stGP-0707/RealData_MouseBrainMERFISH/utils.py:113: UserWarning: constrained_layout not applied because axes sizes collapsed to zero.  Try making figure larger or Axes decorations smaller.
  fig.savefig(str(path), dpi=dpi, bbox_inches="tight")
  [fig] stGP domain pseudotime on a representative slice ...
    [skip pseudotime] pyslingshot unavailable: No module named 'pyslingshot'
  [fig] Program similarity ...
[13]:
from IPython.display import Image
from plots import plot_spacetime_embedding_stack

adata_full = sc.read_h5ad(utils.DATA_QC)
emb = np.asarray(stgp_method.adata.obsm["X_stgp_spatial"], dtype=float)
prog_names = stgp_method.scores.columns.astype(str).tolist()
prog_idx = prog_names.index("stGP2") if "stGP2" in prog_names else 1
fig = plot_spacetime_embedding_stack(
    adata=stgp_method.adata,
    values=emb[:, prog_idx],
    adata_full=adata_full,
    value_label="stGP2 spatial embedding",
    color_scale="symmetric",
    elev=30,
)
save_pair(fig, "Microglia_stGP_stGP2_spatial_embedding_stack_tilt30", fig_dir, bbox_inches="tight", pad_inches=0.05)

[13]:
(PosixPath('Figures/Microglia/Microglia_stGP_stGP2_spatial_embedding_stack_tilt30.png'),
 PosixPath('Figures/Microglia/Microglia_stGP_stGP2_spatial_embedding_stack_tilt30.pdf'))
[14]:
selected_spatial = sorted((fig_dir / "spatial_selected_2x2").rglob("*stGP*stGP2*.png"))
if not selected_spatial:
    selected_spatial = sorted((fig_dir / "spatial_selected_2x2").rglob("*stGP*.png"))[:2]
for path in selected_spatial:
    print(path)
    display(Image(filename=str(path)))
Figures/Microglia/spatial_selected_2x2/Microglia_stGP_stGP2_spatial_2x2.png
