Day 2 Inj-PT spatial fate analysis: right kidney
This notebook mirrors the left-kidney analysis to test replication. The biological question is whether day 2 injured proximal tubule (Inj-PT) cells show the same spatially organized repair-state architecture in the right kidney: an injury-front-like state, a recovering/metabolic state, and a maladaptive/pre-FR-biased state. Reproducing this structure across both sides supports a biological signal rather than stochastic clustering noise.
1. Load the day 2 Inj-PT stGP result
The input is the stGP fit for Inj-PT cells across the right-kidney time course. We subset to Day2R, the matched replicate for the left-kidney analysis, because the kidney reference study identified day 2 as the stage where injured PT cells start diverging toward recovery or failed repair.
[1]:
%matplotlib inline

import os, warnings
from pathlib import Path

import numpy as np
import pandas as pd
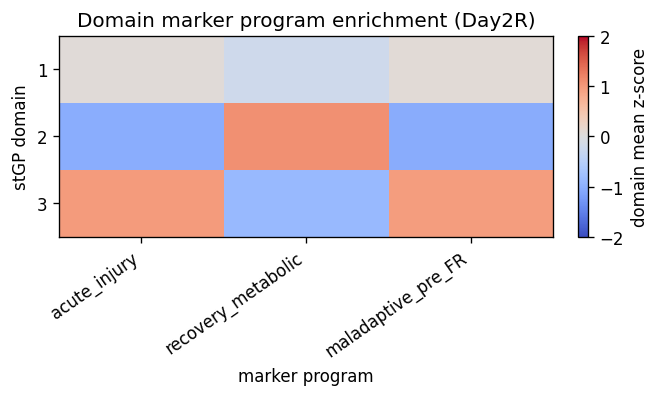
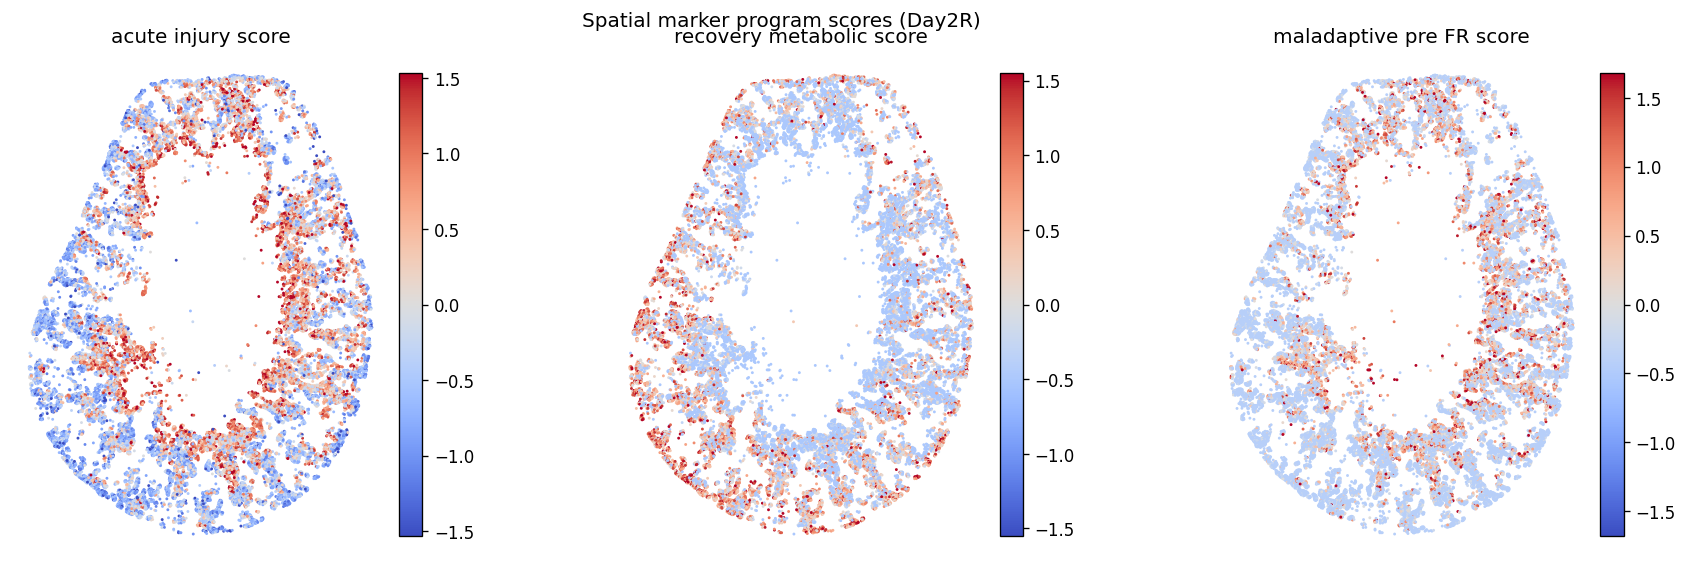
import scanpy as sc
import scipy.sparse as sp
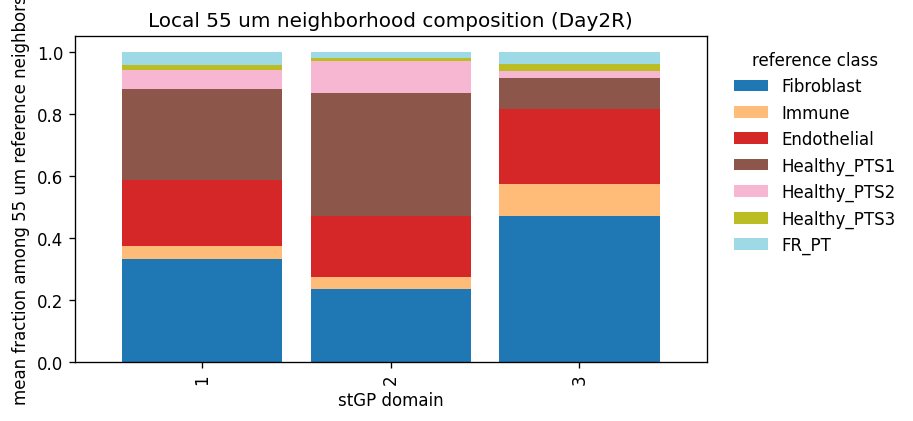
import matplotlib.pyplot as plt
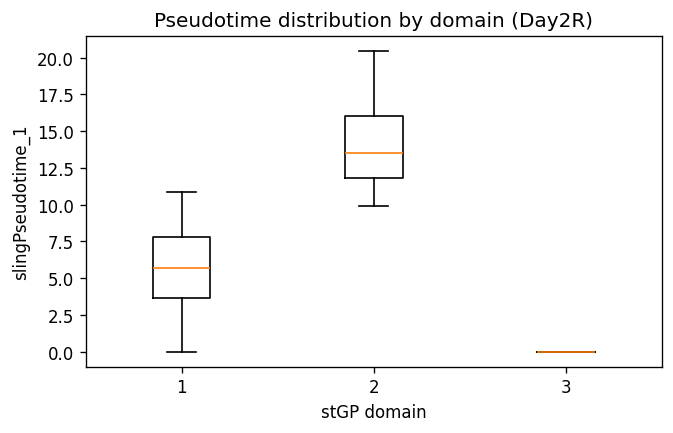
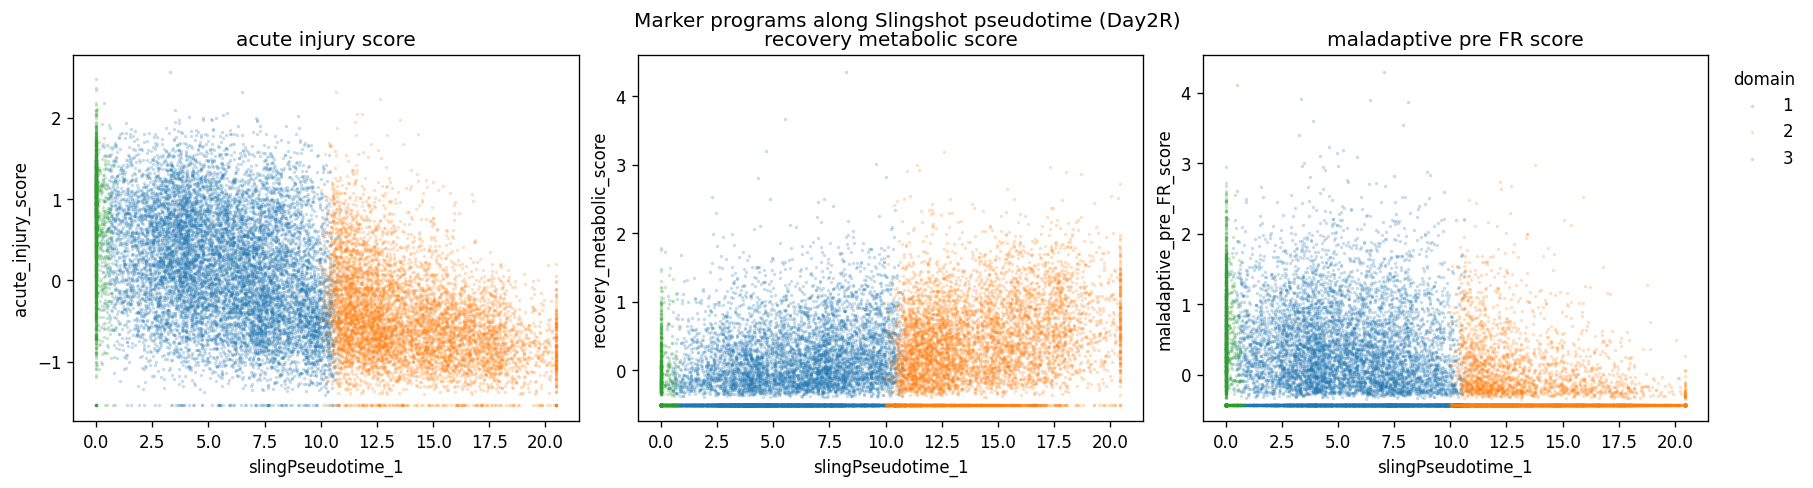
from IPython.display import display, Markdown
from sklearn.neighbors import NearestNeighbors
from sklearn.cluster import SpectralClustering
from pyslingshot import Slingshot

warnings.filterwarnings("ignore", category=FutureWarning)
plt.rcParams["figure.dpi"] = 120

ROOT = Path.cwd()
if ROOT.name != "RealData_MouseKidneyXenium":
    ROOT = Path("/home/byual/stGP-0707/RealData_MouseKidneyXenium")
os.chdir(ROOT)
CELLTYPE = "Inj_PT"
SIDE = "R"
ANALYSIS_NAME = f"{CELLTYPE}_{SIDE}"
STGP_DIR = ROOT / "Results" / "stgp" / ANALYSIS_NAME
ADATA_PATH = STGP_DIR / "adata_with_scores.h5ad"
SLICE_ID = f"Day2{SIDE}"
OUT_DIR = STGP_DIR / f"pseudotime_{SLICE_ID}"
FIG_DIR = ROOT / "Figures" / ANALYSIS_NAME / f"pseudotime_{SLICE_ID}"
OUT_DIR.mkdir(parents=True, exist_ok=True)
FIG_DIR.mkdir(parents=True, exist_ok=True)

ROOT_TRUTH_LABEL = "CN2: Cortical Proximal Tubule"
N_EPOCHS = 10
RANDOM_STATE = 1234

adata_full = sc.read_h5ad(ADATA_PATH)
mask = adata_full.obs["ident"].astype(str).to_numpy() == str(SLICE_ID)
if not mask.any():
    available = sorted(adata_full.obs["ident"].astype(str).unique())
    raise ValueError(f"SLICE_ID={SLICE_ID!r} not found. Available slices: {available}")

adata = adata_full[mask].copy()
label_suffix = str(SLICE_ID)

print(adata)
print(f"Analysis slice: {label_suffix}; n_obs={adata.n_obs}, n_vars={adata.n_vars}")
print(adata.obs[["ident", "time", "injury_time_days"]].drop_duplicates().to_string(index=False))
/home/byual/anaconda3/envs/NicheScope/lib/python3.9/site-packages/pyslingshot/slingshot.py:11: TqdmWarning: IProgress not found. Please update jupyter and ipywidgets. See https://ipywidgets.readthedocs.io/en/stable/user_install.html
  from tqdm.autonotebook import tqdm
AnnData object with n_obs × n_vars = 19408 × 299
    obs: 'x_centroid', 'y_centroid', 'n_genes', 'n_counts', 'ident', 'region', 'celltype_plot', 'time', 'CN', 'injury_time_days', 'side', 'age'
    uns: 'CN_colors', 'celltype_plot_colors', 'ident_colors', 'neighbors', 'pca', 'stgp', 'umap'
    obsm: 'X_pca', 'X_pca_harmony', 'X_stgp', 'X_stgp_spatial', 'X_umap', 'spatial'
    varm: 'PCs'
    obsp: 'connectivities', 'distances'
Analysis slice: Day2R; n_obs=19408, n_vars=299
ident time  injury_time_days
Day2R Day2               2.0
2. Define three stGP spatial domains
We use the same KNN spectral clustering strategy as the left kidney, clustering in the stGP spatial embedding rather than in raw expression space. K = 3 tests the same repair-fate hypothesis in the replicate section. Domain IDs are replicate-specific and are interpreted only after marker, PT-state, CN, and neighbor validation.
[2]:
b = np.asarray(adata.obsm["X_stgp_spatial"])
n_clusters = 3
k_nn = int(np.round(np.sqrt(b.shape[0])))

nn = NearestNeighbors(n_neighbors=k_nn + 1, metric="euclidean").fit(b).kneighbors(return_distance=False)[:, 1:]
rows = np.repeat(np.arange(nn.shape[0]), k_nn)
cols = nn.ravel()
knn_graph = sp.csr_matrix((np.ones(rows.size), (rows, cols)), shape=(b.shape[0], b.shape[0]))
knn_graph = knn_graph.maximum(knn_graph.T)

clusterlabel = SpectralClustering(
    n_clusters=n_clusters,
    affinity="precomputed",
    assign_labels="kmeans",
    random_state=RANDOM_STATE,
).fit_predict(knn_graph) + 1

adata.obs["stGP_domain"] = pd.Categorical(clusterlabel.astype(str))
[3]:
xy = np.asarray(adata.obsm["spatial"])
domain_labels = adata.obs["stGP_domain"].astype(str).to_numpy()

fig, ax = plt.subplots(figsize=(6, 5), constrained_layout=True)
for label in adata.obs["stGP_domain"].cat.categories:
    mask = domain_labels == str(label)
    ax.scatter(xy[mask, 0], xy[mask, 1], s=3, linewidths=0, rasterized=True, label=str(label))

ax.set_aspect("equal")
ax.invert_yaxis()
ax.axis("off")
ax.set_title(f"stGP domains on spatial coordinates ({label_suffix})")
ax.legend(title="stGP_domain", markerscale=2, bbox_to_anchor=(1.02, 1), loc="upper left")

fig.savefig(FIG_DIR / f"{label_suffix}_stgp_domains_spatial.png", dpi=300, bbox_inches="tight")
plt.show()

display(Markdown(
    "### What the stGP domains show\n"
    "The right-kidney domains are evaluated for the same spatial logic as the left kidney: coherent domains and an inner injury-front-like structure provide evidence that the day 2 Inj-PT state landscape is organized by tissue architecture rather than random clustering."
))
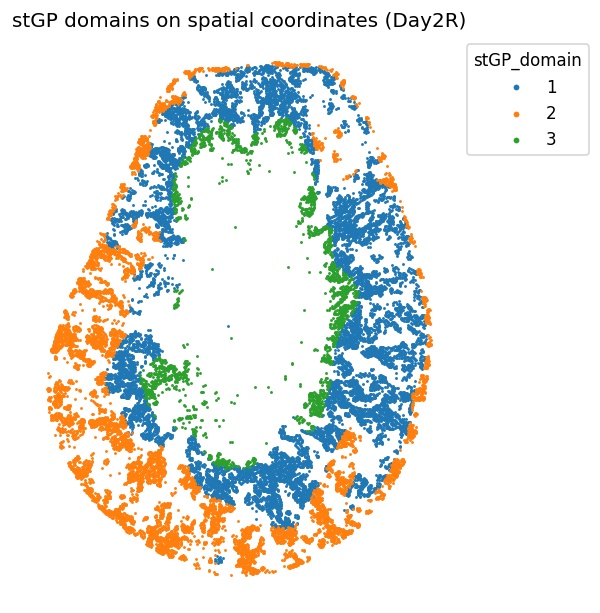
What the stGP domains show
The right-kidney domains are evaluated for the same spatial logic as the left kidney: coherent domains and an inner injury-front-like structure provide evidence that the day 2 Inj-PT state landscape is organized by tissue architecture rather than random clustering.
3. Infer a state-continuum pseudotime
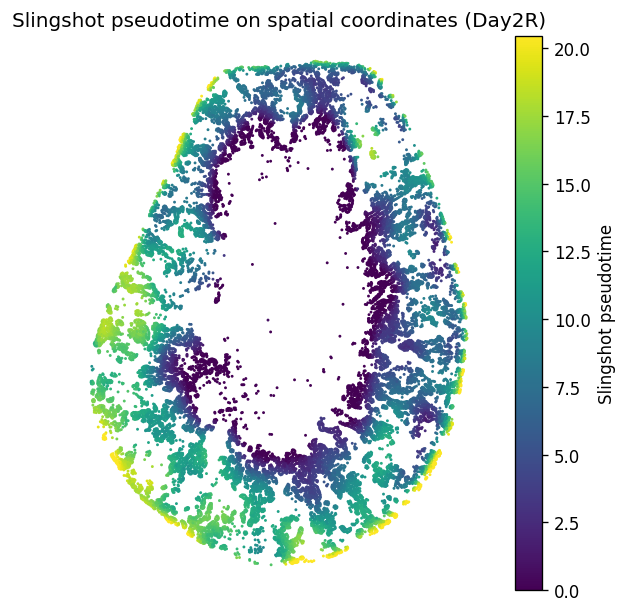
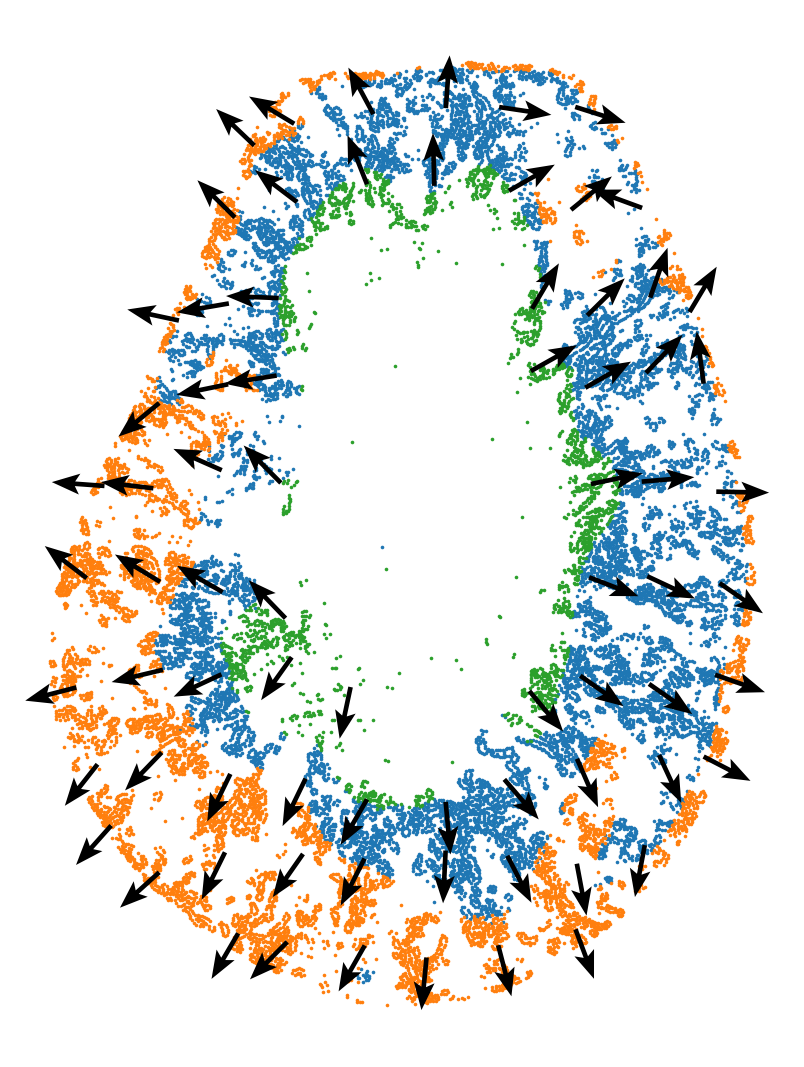
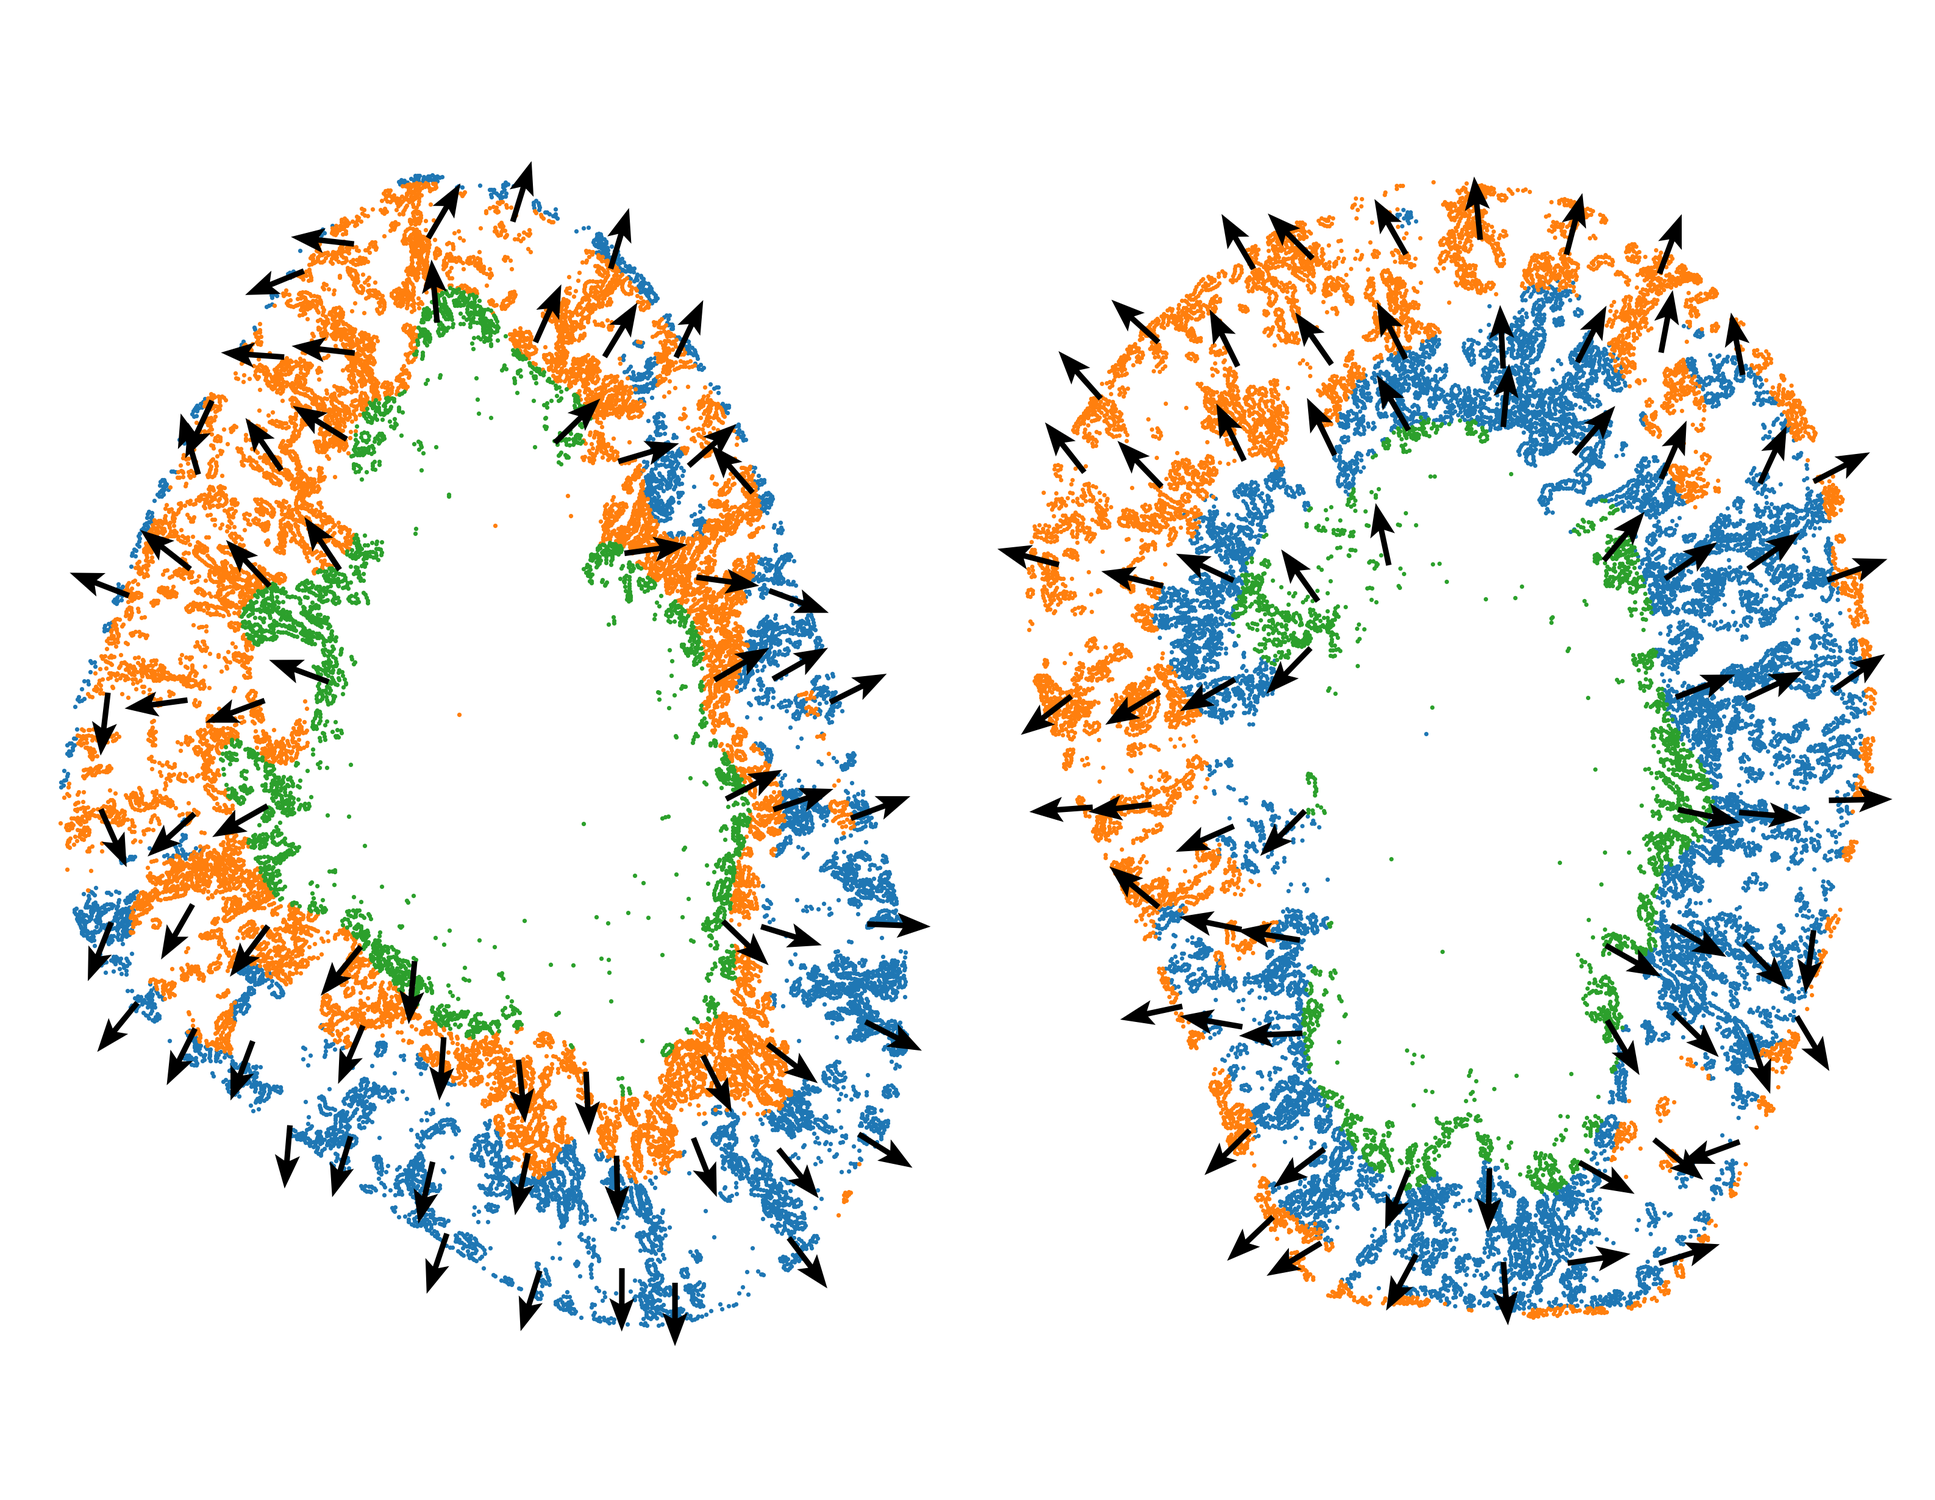
As in the left kidney, this is not chronological time because all cells are from day 2. The Slingshot curve is used as a fate-potential ordering through the stGP domains, rooted at the severe injury-front domain (start_cluster = "3") for consistency with the left-side analysis.
[4]:
DRM = np.asarray(adata.obsm["X_stgp_spatial"])
if DRM.shape[0] != adata.n_obs:
    DRM = DRM.T
adata.obsm["X_DRM"] = np.asarray(DRM)
adata.obs["clusterlabel"] = pd.Categorical(adata.obs["stGP_domain"].astype(str))

cats = adata.obs["clusterlabel"].cat.categories.astype(str)
print("Cluster categories:", list(cats))
Cluster categories: ['1', '2', '3']
[5]:
start_cluster = "3"
start_node = list(cats).index(start_cluster)
print(f"Start cluster: {start_cluster} (start_node={start_node})")

sl = Slingshot(
    adata,
    celltype_key="clusterlabel",
    obsm_key="X_DRM",
    start_node=start_node,
)
sl.fit(num_epochs=N_EPOCHS)
Start cluster: 3 (start_node=2)
  0%|          | 0/10 [00:00<?, ?it/s]/home/byual/anaconda3/envs/NicheScope/lib/python3.9/site-packages/pyslingshot/slingshot.py:333: RuntimeWarning: invalid value encountered in divide
  cell_weights = z_prime / np.nanmax(z_prime, axis=1, keepdims=True) #rowMins(D) / D
 10%|█         | 1/10 [01:01<09:14, 61.63s/it]/home/byual/anaconda3/envs/NicheScope/lib/python3.9/site-packages/pyslingshot/slingshot.py:333: RuntimeWarning: invalid value encountered in divide
  cell_weights = z_prime / np.nanmax(z_prime, axis=1, keepdims=True) #rowMins(D) / D
100%|██████████| 10/10 [10:18<00:00, 61.89s/it]
[6]:
adata.obs["slingPseudotime_1"] = sl.unified_pseudotime

if sl.curves is not None and sl.cell_weights is not None:
    for l_idx, curve in enumerate(sl.curves):
        pt = curve.pseudotimes_interp.copy()
        weight = sl.cell_weights[:, l_idx].copy()
        pt[weight <= 0] = np.nan
        adata.obs[f"slingPseudotime_{l_idx + 1}"] = pt
        adata.obs[f"slingCurveWeight_{l_idx + 1}"] = weight
4. Map the state continuum back to tissue space
The spatial maps test whether the right-kidney stGP domains form coherent anatomical structures, not just expression-space clusters. Replication is expected at the level of architecture and marker/neighborhood evidence, not necessarily identical numeric domain labels.
[7]:
xy = np.asarray(adata.obsm["spatial"])
pt = adata.obs["slingPseudotime_1"].to_numpy(dtype=float)

fig, ax = plt.subplots(figsize=(6, 5), constrained_layout=True)

scat = ax.scatter(
    xy[:, 0], xy[:, 1], c=pt, s=3, cmap="viridis", linewidths=0, rasterized=True
)
ax.set_aspect("equal")
ax.invert_yaxis()
ax.axis("off")
ax.set_title(f"Slingshot pseudotime on spatial coordinates ({label_suffix})")
plt.colorbar(scat, ax=ax, label="Slingshot pseudotime")

fig.savefig(FIG_DIR / f"{label_suffix}_slingshot_pseudotime_spatial.png", dpi=300, bbox_inches="tight")
plt.show()
[8]:
GRIDNUM = 10
MIN_CELLS_PER_GRID = 20
ARROW_LENGTH_FRAC = 0.75

xy = np.asarray(adata.obsm["spatial"])
pt = adata.obs["slingPseudotime_1"].to_numpy(dtype=float)
valid = np.isfinite(pt) & np.all(np.isfinite(xy), axis=1)
xy_valid = xy[valid]
pt_valid = pt[valid]
if xy_valid.size == 0:
    raise ValueError("No finite pseudotime values available for arrow overlay.")

x_edges = np.linspace(xy_valid[:, 0].min(), xy_valid[:, 0].max(), GRIDNUM + 1)
y_edges = np.linspace(xy_valid[:, 1].min(), xy_valid[:, 1].max(), GRIDNUM + 1)
x_bin = np.clip(np.digitize(xy_valid[:, 0], x_edges) - 1, 0, GRIDNUM - 1)
y_bin = np.clip(np.digitize(xy_valid[:, 1], y_edges) - 1, 0, GRIDNUM - 1)

mean_pt = np.full((GRIDNUM, GRIDNUM), np.nan)
mean_xy = np.full((GRIDNUM, GRIDNUM, 2), np.nan)
counts = np.zeros((GRIDNUM, GRIDNUM), dtype=int)

for i in range(GRIDNUM):
    for j in range(GRIDNUM):
        m = (x_bin == i) & (y_bin == j)
        counts[i, j] = int(m.sum())
        if counts[i, j] >= MIN_CELLS_PER_GRID:
            mean_pt[i, j] = float(np.nanmean(pt_valid[m]))
            mean_xy[i, j] = np.nanmean(xy_valid[m], axis=0)

arrow_start = []
arrow_vec = []
for i in range(GRIDNUM):
    for j in range(GRIDNUM):
        if not np.isfinite(mean_pt[i, j]):
            continue
        grad = np.zeros(2, dtype=float)
        center = mean_xy[i, j]
        for di in (-1, 0, 1):
            for dj in (-1, 0, 1):
                if di == 0 and dj == 0:
                    continue
                ni, nj = i + di, j + dj
                if ni < 0 or ni >= GRIDNUM or nj < 0 or nj >= GRIDNUM:
                    continue
                if not np.isfinite(mean_pt[ni, nj]):
                    continue
                direction = mean_xy[ni, nj] - center
                dist = np.linalg.norm(direction)
                if dist == 0:
                    continue
                grad += (mean_pt[ni, nj] - mean_pt[i, j]) * direction / dist
        norm = np.linalg.norm(grad)
        if norm > 0:
            arrow_start.append(center)
            arrow_vec.append(grad / norm)

arrow_start = np.asarray(arrow_start)
arrow_vec = np.asarray(arrow_vec)
cell_size = min(np.diff(x_edges).mean(), np.diff(y_edges).mean())
arrow_vec = arrow_vec * cell_size * ARROW_LENGTH_FRAC

fig, ax = plt.subplots(figsize=(7, 7), constrained_layout=True)
for label in adata.obs["clusterlabel"].cat.categories:
    mask = adata.obs["clusterlabel"].astype(str).to_numpy() == str(label)
    ax.scatter(xy[mask, 0], xy[mask, 1], s=3, linewidths=0, rasterized=True)

if len(arrow_start) > 0:
    ax.quiver(
        arrow_start[:, 0], arrow_start[:, 1],
        arrow_vec[:, 0], arrow_vec[:, 1],
        angles="xy", scale_units="xy", scale=1,
        color="black", width=0.006,
        headwidth=4.5, headlength=6.0, headaxislength=5.0,
    )

ax.set_aspect("equal")
ax.invert_yaxis()
ax.axis("off")
fig.savefig(FIG_DIR / f"{label_suffix}_slingshot_arrow_overlay.png", dpi=300, bbox_inches="tight")
plt.show()
[9]:
OUT_H5AD = OUT_DIR / f"{label_suffix}_stgp_cluster_slingshot.h5ad"
OUT_OBS = OUT_DIR / f"{label_suffix}_stgp_cluster_slingshot_obs.csv"

adata.write_h5ad(OUT_H5AD, compression="gzip")
adata.obs.to_csv(OUT_OBS)

print(f"Saved trajectory AnnData: {OUT_H5AD.resolve()}")
print(f"Saved trajectory obs: {OUT_OBS.resolve()}")
Saved trajectory AnnData: /import/home4/byual/stGP-0707/RealData_MouseKidneyXenium/Results/stgp/Inj_PT_R/pseudotime_Day2R/Day2R_stgp_cluster_slingshot.h5ad
Saved trajectory obs: /import/home4/byual/stGP-0707/RealData_MouseKidneyXenium/Results/stgp/Inj_PT_R/pseudotime_Day2R/Day2R_stgp_cluster_slingshot_obs.csv
[10]:
DOMAIN_MARKER_SETS = {
    "acute_injury": ["Havcr1", "Krt20", "Plin2", "Srxn1", "Cdkn1a", "Plk3", "Tnfrsf12a"],
    "recovery_metabolic": ["Cxcl12", "Haao", "Kynu", "Hmgcs2"],
    "maladaptive_pre_FR": ["Vcam1", "Serpine1", "Cd44", "Klf5"],
}


def _present_genes(adata_obj, genes):
    lookup = {str(g).upper(): str(g) for g in adata_obj.var_names}
    return [lookup[g.upper()] for g in genes if g.upper() in lookup]


def _dense_matrix(x):
    return x.toarray() if sp.issparse(x) else np.asarray(x)


def add_zscore_gene_program(adata_obj, genes, score_name):
    present = _present_genes(adata_obj, genes)
    missing = [g for g in genes if g.upper() not in {p.upper() for p in present}]
    if len(present) == 0:
        adata_obj.obs[score_name] = np.nan
        return present, missing
    X = _dense_matrix(adata_obj[:, present].X).astype(float)
    gene_mean = np.nanmean(X, axis=0, keepdims=True)
    gene_sd = np.nanstd(X, axis=0, keepdims=True)
    gene_sd[gene_sd == 0] = 1.0
    adata_obj.obs[score_name] = np.nanmean((X - gene_mean) / gene_sd, axis=1)
    return present, missing


marker_availability = []
score_cols = []
for program, genes in DOMAIN_MARKER_SETS.items():
    score_col = f"{program}_score"
    present, missing = add_zscore_gene_program(adata, genes, score_col)
    score_cols.append(score_col)
    marker_availability.append({
        "program": program,
        "score_col": score_col,
        "n_present": len(present),
        "present_genes": ", ".join(present),
        "missing_genes": ", ".join(missing),
    })

marker_availability = pd.DataFrame(marker_availability)
marker_availability.to_csv(OUT_DIR / f"{label_suffix}_domain_marker_gene_availability.csv", index=False)
display(marker_availability)

domain_score_summary = adata.obs.groupby("stGP_domain", observed=True)[score_cols].agg(["mean", "median", "std"]).round(3)
domain_score_summary.to_csv(OUT_DIR / f"{label_suffix}_stgp_domain_marker_score_summary.csv")
display(domain_score_summary)

domain_score_mean = adata.obs.groupby("stGP_domain", observed=True)[score_cols].mean()
plot_mat = (domain_score_mean - domain_score_mean.mean(axis=0)) / domain_score_mean.std(axis=0).replace(0, np.nan)
plot_mat = plot_mat.fillna(0)

fig, ax = plt.subplots(figsize=(5.4, 3.2), constrained_layout=True)
im = ax.imshow(plot_mat.to_numpy(), cmap="coolwarm", aspect="auto", vmin=-2, vmax=2)
ax.set_xticks(np.arange(len(score_cols)))
ax.set_xticklabels([c.replace("_score", "") for c in score_cols], rotation=35, ha="right")
ax.set_yticks(np.arange(plot_mat.shape[0]))
ax.set_yticklabels(plot_mat.index.astype(str))
ax.set_xlabel("marker program")
ax.set_ylabel("stGP domain")
ax.set_title(f"Domain marker program enrichment ({label_suffix})")
plt.colorbar(im, ax=ax, label="domain mean z-score")
fig.savefig(FIG_DIR / f"{label_suffix}_stgp_domain_marker_score_heatmap.png", dpi=300, bbox_inches="tight")
plt.show()

xy = np.asarray(adata.obsm["spatial"])
fig, axes = plt.subplots(1, len(score_cols), figsize=(5 * len(score_cols), 4.5), constrained_layout=True)
if len(score_cols) == 1:
    axes = [axes]
for ax, score_col in zip(axes, score_cols):
    values = adata.obs[score_col].to_numpy(dtype=float)
    vmax = np.nanpercentile(np.abs(values), 98)
    scat = ax.scatter(xy[:, 0], xy[:, 1], c=values, s=3, cmap="coolwarm", vmin=-vmax, vmax=vmax, linewidths=0, rasterized=True)
    ax.set_aspect("equal")
    ax.invert_yaxis()
    ax.axis("off")
    ax.set_title(score_col.replace("_", " "))
    plt.colorbar(scat, ax=ax, fraction=0.046, pad=0.02)
fig.suptitle(f"Spatial marker program scores ({label_suffix})", y=1.02)
fig.savefig(FIG_DIR / f"{label_suffix}_marker_program_scores_spatial.png", dpi=300, bbox_inches="tight")
plt.show()

marker_lines = []
for score_col in score_cols:
    top_domain = domain_score_mean[score_col].idxmax()
    marker_lines.append(f"- `{score_col}` is highest in domain `{top_domain}`.")
| program | score_col | n_present | present_genes | missing_genes | |
|---|---|---|---|---|---|
| 0 | acute_injury | acute_injury_score | 3 | Havcr1, Krt20, Plin2 | Srxn1, Cdkn1a, Plk3, Tnfrsf12a |
| 1 | recovery_metabolic | recovery_metabolic_score | 4 | Cxcl12, Haao, Kynu, Hmgcs2 | |
| 2 | maladaptive_pre_FR | maladaptive_pre_FR_score | 4 | Vcam1, Serpine1, Cd44, Klf5 |
| acute_injury_score | recovery_metabolic_score | maladaptive_pre_FR_score | |||||||
|---|---|---|---|---|---|---|---|---|---|
| mean | median | std | mean | median | std | mean | median | std | |
| stGP_domain | |||||||||
| 1 | 0.157 | 0.140 | 0.703 | -0.128 | -0.341 | 0.505 | 0.085 | -0.134 | 0.629 |
| 2 | -0.474 | -0.562 | 0.559 | 0.322 | 0.266 | 0.654 | -0.252 | -0.429 | 0.380 |
| 3 | 0.692 | 0.794 | 0.659 | -0.355 | -0.507 | 0.331 | 0.360 | 0.289 | 0.695 |
[11]:
import h5py

PT_REF_PATH = ROOT / "data" / "pt_ad_BBKNN_annotated.h5ad"
REF_OBS_COLS = ["celltype_bbknn", "bbknn_res2"]


def _decode_h5_array(values):
    return np.asarray([v.decode("utf-8") if isinstance(v, (bytes, np.bytes_)) else v for v in values], dtype=object)


def _read_h5_obs_column(h5_file, col):
    obj = h5_file["obs"][col]
    if isinstance(obj, h5py.Group) and {"categories", "codes"}.issubset(obj.keys()):
        categories = _decode_h5_array(obj["categories"][:])
        codes = np.asarray(obj["codes"][:], dtype=int)
        values = np.full(codes.shape[0], None, dtype=object)
        valid = codes >= 0
        values[valid] = categories[codes[valid]]
        return values
    return _decode_h5_array(obj[:])


if PT_REF_PATH.exists():
    with h5py.File(PT_REF_PATH, "r") as f:
        ref_cols = [c for c in REF_OBS_COLS if c in f["obs"]]
        ref_obs = pd.DataFrame({col: _read_h5_obs_column(f, col) for col in ref_cols}, index=_decode_h5_array(f["obs/_index"][:]).astype(str))
    common_obs = adata.obs_names.intersection(ref_obs.index)
    for col in ref_cols:
        adata.obs[f"pt_ref_{col}"] = pd.Series(index=adata.obs_names, dtype="object")
        adata.obs.loc[common_obs, f"pt_ref_{col}"] = ref_obs.loc[common_obs, col].astype(str).to_numpy()
        adata.obs[f"pt_ref_{col}"] = pd.Categorical(adata.obs[f"pt_ref_{col}"])
else:
    print(f"PT reference not found: {PT_REF_PATH}")

composition_cols = [c for c in ["pt_ref_celltype_bbknn", "pt_ref_bbknn_res2"] if c in adata.obs.columns]
composition_tables = {}
for col in composition_cols:
    table = pd.crosstab(adata.obs["stGP_domain"], adata.obs[col], normalize="index")
    table = table.loc[:, table.sum(axis=0).sort_values(ascending=False).index]
    composition_tables[col] = table
    table.to_csv(OUT_DIR / f"{label_suffix}_stgp_domain_{col}_fraction.csv")
    print(f"\n{col} fraction by stGP_domain")
    display(table.round(3))

    fig, ax = plt.subplots(figsize=(7.5, 3.4), constrained_layout=True)
    table.plot(kind="bar", stacked=True, ax=ax, width=0.85, colormap="tab20")
    ax.set_ylabel("fraction within domain")
    ax.set_xlabel("stGP domain")
    ax.set_title(f"{col} composition by stGP domain ({label_suffix})")
    ax.legend(title=col, bbox_to_anchor=(1.02, 1), loc="upper left", frameon=False)
    fig.savefig(FIG_DIR / f"{label_suffix}_stgp_domain_{col}_stacked_fraction.png", dpi=300, bbox_inches="tight")
    plt.show()

if "CN" in adata.obs.columns:
    cn_count = pd.crosstab(adata.obs["stGP_domain"], adata.obs["CN"])
    cn_frac = pd.crosstab(adata.obs["stGP_domain"], adata.obs["CN"], normalize="index")
    cn_count.to_csv(OUT_DIR / f"{label_suffix}_stgp_domain_CN_count.csv")
    cn_frac.to_csv(OUT_DIR / f"{label_suffix}_stgp_domain_CN_fraction.csv")
    cn_focus_cols = [c for c in cn_frac.columns if ("CN4" in str(c)) or ("CN7" in str(c))]
    if len(cn_focus_cols) > 0:
        display(cn_frac[cn_focus_cols].round(3))
PT reference not found: /import/home4/byual/stGP-0707/RealData_MouseKidneyXenium/data/pt_ad_BBKNN_annotated.h5ad
| CN | CN4: Injured Proximal Tubule | CN7: Fibro-inflammatory Niche |
|---|---|---|
| stGP_domain | ||
| 1 | 0.784 | 0.062 |
| 2 | 0.748 | 0.035 |
| 3 | 0.695 | 0.101 |
[12]:
NEIGHBOR_RADIUS_UM = 55
PROCESSED_DIR = ROOT / "data" / "processed"
NEIGHBOR_REFERENCE_FILES = {
    "Fibroblast": "Fib.h5ad",
    "Immune": "Immune.h5ad",
    "Endothelial": "EC.h5ad",
    "Healthy_PTS1": "PTS1.h5ad",
    "Healthy_PTS2": "PTS2.h5ad",
    "Healthy_PTS3": "PTS3.h5ad",
    "FR_PT": "FR_PT.h5ad",
}


def _load_spatial_reference(processed_dir, label_suffix, file_map):
    frames = []
    for label, fname in file_map.items():
        path = processed_dir / fname
        if not path.exists():
            print(f"Skipping missing neighbor reference: {path}")
            continue
        with h5py.File(path, "r") as f:
            if "obs" not in f or "ident" not in f["obs"] or "obsm" not in f or "spatial" not in f["obsm"]:
                print(f"Skipping {path.name}: missing ident or spatial coordinates")
                continue
            ident = _read_h5_obs_column(f, "ident").astype(str)
            mask = ident == str(label_suffix)
            if mask.sum() == 0:
                continue
            coords = np.asarray(f["obsm/spatial"])[mask]
            index = _decode_h5_array(f["obs/_index"][:]).astype(str)[mask]
        frames.append(pd.DataFrame({"obs_name": index, "neighbor_class": label, "x": coords[:, 0], "y": coords[:, 1]}))
    if len(frames) == 0:
        return pd.DataFrame(columns=["obs_name", "neighbor_class", "x", "y"])
    return pd.concat(frames, ignore_index=True)


neighbor_ref = _load_spatial_reference(PROCESSED_DIR, label_suffix, NEIGHBOR_REFERENCE_FILES)
print(f"Loaded {len(neighbor_ref):,} reference cells for {NEIGHBOR_RADIUS_UM} um neighborhood analysis")
display(neighbor_ref["neighbor_class"].value_counts().rename("n_reference_cells").to_frame())

if len(neighbor_ref) > 0:
    ref_xy = neighbor_ref[["x", "y"]].to_numpy(dtype=float)
    ref_class = neighbor_ref["neighbor_class"].to_numpy()
    query_xy = np.asarray(adata.obsm["spatial"])
    neighbor_classes = list(NEIGHBOR_REFERENCE_FILES.keys())

    nbrs = NearestNeighbors(radius=NEIGHBOR_RADIUS_UM, metric="euclidean").fit(ref_xy)
    neighbor_idx = nbrs.radius_neighbors(query_xy, return_distance=False)
    neighbor_counts = np.zeros((adata.n_obs, len(neighbor_classes)), dtype=int)
    for i, idx in enumerate(neighbor_idx):
        if len(idx) == 0:
            continue
        counts = pd.Series(ref_class[idx]).value_counts()
        for j, cls in enumerate(neighbor_classes):
            neighbor_counts[i, j] = int(counts.get(cls, 0))

    count_cols = [f"neighbor55_count_{cls}" for cls in neighbor_classes]
    frac_cols = [f"neighbor55_frac_{cls}" for cls in neighbor_classes]
    total_neighbors = neighbor_counts.sum(axis=1)
    frac = np.divide(neighbor_counts, total_neighbors[:, None], out=np.full(neighbor_counts.shape, np.nan, dtype=float), where=total_neighbors[:, None] > 0)

    for j, col in enumerate(count_cols):
        adata.obs[col] = neighbor_counts[:, j]
    for j, col in enumerate(frac_cols):
        adata.obs[col] = frac[:, j]
    adata.obs["neighbor55_total_reference_cells"] = total_neighbors

    neighbor_domain_summary = pd.concat([
        adata.obs.groupby("stGP_domain", observed=True)[count_cols].mean().add_suffix("_mean"),
        adata.obs.groupby("stGP_domain", observed=True)[frac_cols].mean().add_suffix("_mean"),
        adata.obs.groupby("stGP_domain", observed=True)["neighbor55_total_reference_cells"].mean().rename("total_reference_cells_mean"),
    ], axis=1)
    neighbor_domain_summary.to_csv(OUT_DIR / f"{label_suffix}_stgp_domain_neighbor55um_summary.csv")
    display(neighbor_domain_summary.round(3))

    frac_summary = adata.obs.groupby("stGP_domain", observed=True)[frac_cols].mean()
    frac_summary.columns = [c.replace("neighbor55_frac_", "") for c in frac_summary.columns]
    fig, ax = plt.subplots(figsize=(7.5, 3.4), constrained_layout=True)
    frac_summary.plot(kind="bar", stacked=True, ax=ax, width=0.85, colormap="tab20")
    ax.set_ylabel("mean fraction among 55 um reference neighbors")
    ax.set_xlabel("stGP domain")
    ax.set_title(f"Local 55 um neighborhood composition ({label_suffix})")
    ax.legend(title="reference class", bbox_to_anchor=(1.02, 1), loc="upper left", frameon=False)
    fig.savefig(FIG_DIR / f"{label_suffix}_stgp_domain_neighbor55um_stacked_fraction.png", dpi=300, bbox_inches="tight")
    plt.show()

    fibro_immune = adata.obs.groupby("stGP_domain", observed=True)[["neighbor55_frac_Fibroblast", "neighbor55_frac_Immune"]].mean().sum(axis=1)
    top_fibro_immune_domain = fibro_immune.idxmax()
Skipping missing neighbor reference: /import/home4/byual/stGP-0707/RealData_MouseKidneyXenium/data/processed/EC.h5ad
Skipping missing neighbor reference: /import/home4/byual/stGP-0707/RealData_MouseKidneyXenium/data/processed/PTS1.h5ad
Skipping missing neighbor reference: /import/home4/byual/stGP-0707/RealData_MouseKidneyXenium/data/processed/PTS2.h5ad
Skipping missing neighbor reference: /import/home4/byual/stGP-0707/RealData_MouseKidneyXenium/data/processed/PTS3.h5ad
Skipping missing neighbor reference: /import/home4/byual/stGP-0707/RealData_MouseKidneyXenium/data/processed/FR_PT.h5ad
Loaded 20,826 reference cells for 55 um neighborhood analysis
| n_reference_cells | |
|---|---|
| neighbor_class | |
| Fibroblast | 17182 |
| Immune | 3644 |
| neighbor55_count_Fibroblast_mean | neighbor55_count_Immune_mean | neighbor55_count_Endothelial_mean | neighbor55_count_Healthy_PTS1_mean | neighbor55_count_Healthy_PTS2_mean | neighbor55_count_Healthy_PTS3_mean | neighbor55_count_FR_PT_mean | neighbor55_frac_Fibroblast_mean | neighbor55_frac_Immune_mean | neighbor55_frac_Endothelial_mean | neighbor55_frac_Healthy_PTS1_mean | neighbor55_frac_Healthy_PTS2_mean | neighbor55_frac_Healthy_PTS3_mean | neighbor55_frac_FR_PT_mean | total_reference_cells_mean | |
|---|---|---|---|---|---|---|---|---|---|---|---|---|---|---|---|
| stGP_domain | |||||||||||||||
| 1 | 9.439 | 1.228 | 0.0 | 0.0 | 0.0 | 0.0 | 0.0 | 0.885 | 0.115 | 0.0 | 0.0 | 0.0 | 0.0 | 0.0 | 10.666 |
| 2 | 7.410 | 1.192 | 0.0 | 0.0 | 0.0 | 0.0 | 0.0 | 0.844 | 0.156 | 0.0 | 0.0 | 0.0 | 0.0 | 0.0 | 8.603 |
| 3 | 12.108 | 2.804 | 0.0 | 0.0 | 0.0 | 0.0 | 0.0 | 0.833 | 0.167 | 0.0 | 0.0 | 0.0 | 0.0 | 0.0 | 14.912 |
[13]:
# Integrate marker, CN, neighborhood, and pseudotime evidence into one domain-level table.
domain_validation = pd.DataFrame(index=adata.obs["stGP_domain"].cat.categories.astype(str))
domain_validation.index.name = "stGP_domain"
domain_validation["n_cells"] = adata.obs["stGP_domain"].astype(str).value_counts().reindex(domain_validation.index).astype(int)

for score_col in score_cols:
    domain_validation[f"mean_{score_col}"] = adata.obs.groupby("stGP_domain", observed=True)[score_col].mean().reindex(domain_validation.index)
    domain_validation[f"median_{score_col}"] = adata.obs.groupby("stGP_domain", observed=True)[score_col].median().reindex(domain_validation.index)

pt_cols = [c for c in adata.obs.columns if c.startswith("slingPseudotime")]
weight_cols = [c for c in adata.obs.columns if c.startswith("slingCurveWeight")]
for col in pt_cols + weight_cols:
    domain_validation[f"mean_{col}"] = adata.obs.groupby("stGP_domain", observed=True)[col].mean().reindex(domain_validation.index)
    domain_validation[f"median_{col}"] = adata.obs.groupby("stGP_domain", observed=True)[col].median().reindex(domain_validation.index)

if "CN" in adata.obs.columns:
    cn_frac = pd.crosstab(adata.obs["stGP_domain"], adata.obs["CN"], normalize="index")
    for cn_label in cn_frac.columns:
        if ("CN4" in str(cn_label)) or ("CN7" in str(cn_label)):
            domain_validation[f"frac_{cn_label}"] = cn_frac[cn_label].reindex(domain_validation.index)

if "pt_ref_celltype_bbknn" in adata.obs.columns:
    pt_state_frac = pd.crosstab(adata.obs["stGP_domain"], adata.obs["pt_ref_celltype_bbknn"], normalize="index")
    for state in ["Inj_S1", "Inj_S2", "Inj_S3", "Failed_repair", "Healthy_S1", "Healthy_S2", "Healthy_S3"]:
        if state in pt_state_frac.columns:
            domain_validation[f"frac_pt_state_{state}"] = pt_state_frac[state].reindex(domain_validation.index)

neighbor_frac_cols = [c for c in adata.obs.columns if c.startswith("neighbor55_frac_")]
for col in neighbor_frac_cols:
    short = col.replace("neighbor55_frac_", "neighbor55_mean_frac_")
    domain_validation[short] = adata.obs.groupby("stGP_domain", observed=True)[col].mean().reindex(domain_validation.index)

mean_score_cols = [f"mean_{c}" for c in score_cols if f"mean_{c}" in domain_validation.columns]
if len(mean_score_cols) > 0:
    top_score_col = domain_validation[mean_score_cols].idxmax(axis=1)
    domain_validation["top_marker_program"] = top_score_col.str.replace("mean_", "", regex=False).str.replace("_score", "", regex=False)


def _z(series):
    series = pd.to_numeric(series, errors="coerce")
    sd = series.std()
    if not np.isfinite(sd) or sd == 0:
        return series * 0
    return (series - series.mean()) / sd

cn4_col = next((c for c in domain_validation.columns if c.startswith("frac_CN4")), None)
cn7_col = next((c for c in domain_validation.columns if c.startswith("frac_CN7")), None)
components = {
    "recovery_integrated_evidence": ["mean_recovery_metabolic_score"],
    "acute_integrated_evidence": ["mean_acute_injury_score", cn4_col],
    "maladaptive_integrated_evidence": ["mean_maladaptive_pre_FR_score", cn7_col, "neighbor55_mean_frac_Fibroblast", "neighbor55_mean_frac_Immune", "frac_pt_state_Inj_S3", "frac_pt_state_Failed_repair"],
}
for name, cols in components.items():
    valid_cols = [c for c in cols if c is not None and c in domain_validation.columns]
    domain_validation[name] = sum(_z(domain_validation[c]) for c in valid_cols) if valid_cols else np.nan

role_map = {}
available_domains = list(domain_validation.index)
recovery_domain = domain_validation["recovery_integrated_evidence"].idxmax()
role_map[recovery_domain] = "recovering / metabolic Inj-PT"
remaining = [d for d in available_domains if d not in role_map]
maladaptive_domain = domain_validation.loc[remaining, "maladaptive_integrated_evidence"].idxmax()
role_map[maladaptive_domain] = "maladaptive-biased injury-front / pre-FR Inj-PT"
remaining = [d for d in available_domains if d not in role_map]
acute_domain = domain_validation.loc[remaining, "acute_integrated_evidence"].idxmax() if len(remaining) > 0 else None
if acute_domain is not None:
    role_map[acute_domain] = "acute-stress transitional Inj-PT"
for domain in available_domains:
    role_map.setdefault(domain, "unassigned Inj-PT spatial state")

domain_validation["integrated_annotation"] = pd.Series(role_map).reindex(domain_validation.index)
domain_validation["interpretation_note"] = "integrated label uses marker scores plus CN4/CN7 and 55um fibroblast/immune context; domain IDs are replicate-specific"

domain_validation = domain_validation.round(4)
domain_validation.to_csv(OUT_DIR / f"{label_suffix}_stgp_domain_validation_summary.csv")
domain_validation[["integrated_annotation", "top_marker_program"]].to_csv(OUT_DIR / f"{label_suffix}_stgp_domain_integrated_annotation.csv")
display(domain_validation)

annotation_lines = [f"- Domain {domain}: **{row['integrated_annotation']}**; top marker program = `{row.get('top_marker_program', 'NA')}`." for domain, row in domain_validation.iterrows()]

if len(pt_cols) > 0:
    pt_col = "slingPseudotime_1" if "slingPseudotime_1" in pt_cols else pt_cols[0]
    domain_order = list(domain_validation.index)
    fig, ax = plt.subplots(figsize=(5.5, 3.5), constrained_layout=True)
    data = [adata.obs.loc[adata.obs["stGP_domain"].astype(str) == d, pt_col].dropna().to_numpy() for d in domain_order]
    ax.boxplot(data, tick_labels=domain_order, showfliers=False)
    ax.set_xlabel("stGP domain")
    ax.set_ylabel(pt_col)
    ax.set_title(f"Pseudotime distribution by domain ({label_suffix})")
    fig.savefig(FIG_DIR / f"{label_suffix}_stgp_domain_pseudotime_boxplot.png", dpi=300, bbox_inches="tight")
    plt.show()

    fig, axes = plt.subplots(1, len(score_cols), figsize=(5 * len(score_cols), 3.8), constrained_layout=True)
    if len(score_cols) == 1:
        axes = [axes]
    for ax, score_col in zip(axes, score_cols):
        for domain in domain_order:
            mask = adata.obs["stGP_domain"].astype(str).to_numpy() == domain
            ax.scatter(adata.obs.loc[mask, pt_col], adata.obs.loc[mask, score_col], s=4, alpha=0.25, linewidths=0, rasterized=True, label=domain)
        ax.set_xlabel(pt_col)
        ax.set_ylabel(score_col)
        ax.set_title(score_col.replace("_", " "))
    axes[-1].legend(title="domain", bbox_to_anchor=(1.02, 1), loc="upper left", frameon=False)
    fig.suptitle(f"Marker programs along Slingshot pseudotime ({label_suffix})", y=1.03)
    fig.savefig(FIG_DIR / f"{label_suffix}_marker_scores_vs_pseudotime.png", dpi=300, bbox_inches="tight")
    plt.show()
| n_cells | mean_acute_injury_score | median_acute_injury_score | mean_recovery_metabolic_score | median_recovery_metabolic_score | mean_maladaptive_pre_FR_score | median_maladaptive_pre_FR_score | mean_slingPseudotime_1 | median_slingPseudotime_1 | mean_slingCurveWeight_1 | ... | neighbor55_mean_frac_Healthy_PTS1 | neighbor55_mean_frac_Healthy_PTS2 | neighbor55_mean_frac_Healthy_PTS3 | neighbor55_mean_frac_FR_PT | top_marker_program | recovery_integrated_evidence | acute_integrated_evidence | maladaptive_integrated_evidence | integrated_annotation | interpretation_note | |
|---|---|---|---|---|---|---|---|---|---|---|---|---|---|---|---|---|---|---|---|---|---|
| stGP_domain | |||||||||||||||||||||
| 1 | 10843 | 0.1569 | 0.1402 | -0.1281 | -0.3412 | 0.0849 | -0.1343 | 7.8489 | 7.8441 | 1.0 | ... | 0.0 | 0.0 | 0.0 | 0.0 | acute_injury | -0.2163 | 0.9824 | -0.0532 | acute-stress transitional Inj-PT | integrated label uses marker scores plus CN4/C... |
| 2 | 6540 | -0.4743 | -0.5623 | 0.3222 | 0.2656 | -0.2521 | -0.4286 | 16.3580 | 15.7957 | 1.0 | ... | 0.0 | 0.0 | 0.0 | 0.0 | recovery_metabolic | 1.0904 | -0.8942 | -1.9662 | recovering / metabolic Inj-PT | integrated label uses marker scores plus CN4/C... |
| 3 | 2025 | 0.6917 | 0.7937 | -0.3548 | -0.5067 | 0.3596 | 0.2890 | 0.6948 | 0.0000 | 1.0 | ... | 0.0 | 0.0 | 0.0 | 0.0 | acute_injury | -0.8742 | -0.0883 | 2.0194 | maladaptive-biased injury-front / pre-FR Inj-PT | integrated label uses marker scores plus CN4/C... |
3 rows × 26 columns
[14]:
# Save the augmented right-kidney object after adding validation scores and neighborhood summaries.
OUT_H5AD_VALIDATED = OUT_DIR / f"{label_suffix}_stgp_cluster_slingshot_validated.h5ad"
OUT_OBS_VALIDATED = OUT_DIR / f"{label_suffix}_stgp_cluster_slingshot_validated_obs.csv"

adata.write_h5ad(OUT_H5AD_VALIDATED, compression="gzip")
adata.obs.to_csv(OUT_OBS_VALIDATED)

print(f"Saved validated trajectory AnnData: {OUT_H5AD_VALIDATED.resolve()}")
print(f"Saved validated obs table: {OUT_OBS_VALIDATED.resolve()}")
print(f"Validation summaries are in: {OUT_DIR.resolve()}")
print(f"Figures are in: {FIG_DIR.resolve()}")
Saved validated trajectory AnnData: /import/home4/byual/stGP-0707/RealData_MouseKidneyXenium/Results/stgp/Inj_PT_R/pseudotime_Day2R/Day2R_stgp_cluster_slingshot_validated.h5ad
Saved validated obs table: /import/home4/byual/stGP-0707/RealData_MouseKidneyXenium/Results/stgp/Inj_PT_R/pseudotime_Day2R/Day2R_stgp_cluster_slingshot_validated_obs.csv
Validation summaries are in: /import/home4/byual/stGP-0707/RealData_MouseKidneyXenium/Results/stgp/Inj_PT_R/pseudotime_Day2R
Figures are in: /import/home4/byual/stGP-0707/RealData_MouseKidneyXenium/Figures/Inj_PT_R/pseudotime_Day2R
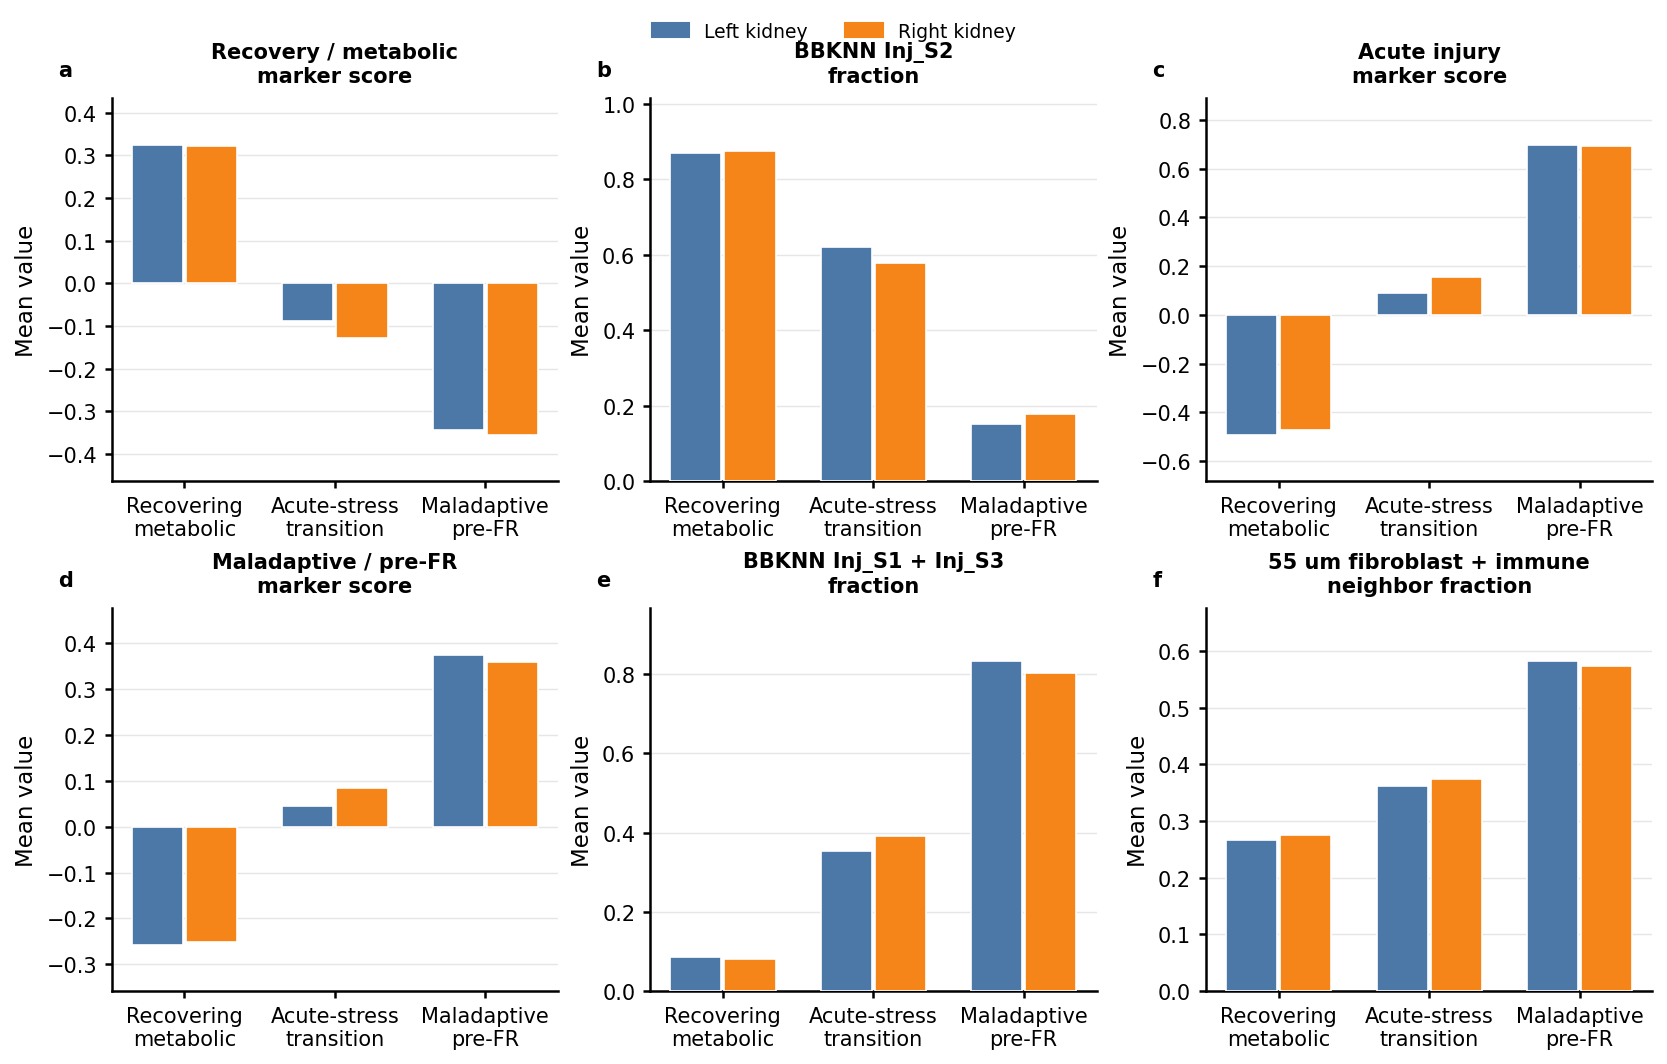
6. Left-right replication figure
Raw CN4/CN7 fractions are not used as primary panels in the final replication figure. CN4 is high in nearly all day 2 Inj-PT domains because the analysis is already restricted to injured proximal tubule cells, so it mainly confirms the background injury context rather than separating the three states. CN7 is biologically important but still rare at day 2, when the fibro-inflammatory niche is only emerging; plotting its absolute fraction makes the signal look small. The final figure therefore emphasizes evidence with clearer dynamic range and direct fate interpretation: marker program scores, BBKNN PT-state composition, and 55 um fibroblast-plus-immune proximity. CN4/CN7 remain in the validation tables as supporting evidence.
[15]:
left_dir = ROOT / "Results" / "stgp" / "Inj_PT_L" / "pseudotime_Day2L"
right_dir = ROOT / "Results" / "stgp" / "Inj_PT_R" / "pseudotime_Day2R"
summary_paths = {
    "L": left_dir / "Day2L_stgp_domain_validation_summary.csv",
    "R": right_dir / "Day2R_stgp_domain_validation_summary.csv",
}

replicate_tables = []
for side_key, path in summary_paths.items():
    if not path.exists():
        raise FileNotFoundError(f"Missing validation summary for side {side_key}: {path}")
    df = pd.read_csv(path, index_col=0)
    df["side"] = side_key
    df["domain"] = df.index.astype(str)
    replicate_tables.append(df)

replicate_summary = pd.concat(replicate_tables, axis=0, ignore_index=True)
role_order = [
    "recovering / metabolic Inj-PT",
    "acute-stress transitional Inj-PT",
    "maladaptive-biased injury-front / pre-FR Inj-PT",
]
if {"neighbor55_mean_frac_Fibroblast", "neighbor55_mean_frac_Immune"}.issubset(replicate_summary.columns):
    replicate_summary["neighbor55_mean_frac_Fibroblast_Immune"] = (
        replicate_summary["neighbor55_mean_frac_Fibroblast"]
        + replicate_summary["neighbor55_mean_frac_Immune"]
    )

if {"frac_pt_state_Inj_S1", "frac_pt_state_Inj_S3"}.issubset(replicate_summary.columns):
    replicate_summary["frac_pt_state_Inj_S1_S3"] = (
        replicate_summary["frac_pt_state_Inj_S1"]
        + replicate_summary["frac_pt_state_Inj_S3"]
    )

if {"neighbor55_mean_frac_Healthy_PTS1", "neighbor55_mean_frac_Healthy_PTS2"}.issubset(replicate_summary.columns):
    replicate_summary["neighbor55_mean_frac_Healthy_PTS1_PTS2"] = (
        replicate_summary["neighbor55_mean_frac_Healthy_PTS1"]
        + replicate_summary["neighbor55_mean_frac_Healthy_PTS2"]
    )

metric_panels = [
    ("mean_recovery_metabolic_score", "Recovery / metabolic\nmarker score", "Cxcl12, Haao, Kynu, Hmgcs2"),
    ("frac_pt_state_Inj_S2", "BBKNN Inj_S2\nfraction", "Recovery-biased PT reference state"),
    ("mean_acute_injury_score", "Acute injury\nmarker score", "Havcr1, Krt20, Plin2"),
    ("mean_maladaptive_pre_FR_score", "Maladaptive / pre-FR\nmarker score", "Vcam1, Serpine1, Cd44, Klf5"),
    ("frac_pt_state_Inj_S1_S3", "BBKNN Inj_S1 + Inj_S3\nfraction", "Vulnerable/injury-front PT states"),
    ("neighbor55_mean_frac_Fibroblast_Immune", "55 um fibroblast + immune\nneighbor fraction", "Local fibro-inflammatory context"),
]
metric_panels = [panel for panel in metric_panels if panel[0] in replicate_summary.columns]
metric_cols = [panel[0] for panel in metric_panels]

replicate_by_role = (
    replicate_summary
    .set_index(["side", "integrated_annotation"])
    .reindex(pd.MultiIndex.from_product([["L", "R"], role_order], names=["side", "integrated_annotation"]))
)
replicate_by_role[["domain", *metric_cols]].to_csv(right_dir / "Day2_left_right_integrated_domain_comparison.csv")
display(replicate_by_role[["domain", *metric_cols]].round(3))

from plots import set_nature_style

set_nature_style()
plot_df = replicate_by_role.reset_index()

role_short = {
    "recovering / metabolic Inj-PT": "Recovering\nmetabolic",
    "acute-stress transitional Inj-PT": "Acute-stress\ntransition",
    "maladaptive-biased injury-front / pre-FR Inj-PT": "Maladaptive\npre-FR",
}
side_colors = {"L": "#4C78A8", "R": "#F58518"}
side_offsets = {"L": -0.18, "R": 0.18}
bar_width = 0.34
x = np.arange(len(role_order))

fig, axes = plt.subplots(2, 3, figsize=(11.0, 6.8), constrained_layout=True)
axes = axes.ravel()

panel_letters = list("abcdef")
for panel_idx, (ax, (metric, title, subtitle)) in enumerate(zip(axes, metric_panels)):
    pivot = plot_df.pivot(index="integrated_annotation", columns="side", values=metric).reindex(role_order)
    for side in ["L", "R"]:
        if side not in pivot.columns:
            continue
        values = pivot[side].to_numpy(dtype=float)
        ax.bar(
            x + side_offsets[side],
            values,
            width=bar_width,
            color=side_colors[side],
            edgecolor="white",
            linewidth=0.8,
            label=f"Day2{side}" if panel_idx == 0 else None,
            zorder=3,
        )
    ax.text(
        -0.12, 1.10, panel_letters[panel_idx], transform=ax.transAxes,
        ha="left", va="top", fontsize=10, fontweight="bold"
    )
    ax.set_title(title, fontsize=10, fontweight="bold", pad=8)
    ax.set_xticks(x)
    ax.set_xticklabels([role_short[r] for r in role_order], rotation=0, ha="center")
    ax.set_ylabel("Mean value")
    ax.grid(axis="y", color="0.90", linewidth=0.7, zorder=0)
    ax.margins(y=0.16)

for ax in axes[len(metric_panels):]:
    ax.axis("off")

handles = [plt.Rectangle((0, 0), 1, 1, color=side_colors[s]) for s in ["L", "R"]]
fig.legend(handles, ["Left kidney", "Right kidney"], loc="upper center", bbox_to_anchor=(0.5, 1.03), ncol=2, frameon=False)
fig.savefig(FIG_DIR / "Day2_left_right_integrated_domain_comparison.png", dpi=400, bbox_inches="tight")
plt.show()

observed_roles = replicate_summary.groupby("side")["integrated_annotation"].apply(set)
replicated_roles = set.intersection(*observed_roles.to_list())
| domain | mean_recovery_metabolic_score | mean_acute_injury_score | mean_maladaptive_pre_FR_score | neighbor55_mean_frac_Fibroblast_Immune | ||
|---|---|---|---|---|---|---|
| side | integrated_annotation | |||||
| L | recovering / metabolic Inj-PT | 1 | 0.325 | -0.493 | -0.257 | 1.0 |
| acute-stress transitional Inj-PT | 2 | -0.087 | 0.089 | 0.044 | 1.0 | |
| maladaptive-biased injury-front / pre-FR Inj-PT | 3 | -0.344 | 0.699 | 0.375 | 1.0 | |
| R | recovering / metabolic Inj-PT | 2 | 0.322 | -0.474 | -0.252 | 1.0 |
| acute-stress transitional Inj-PT | 1 | -0.128 | 0.157 | 0.085 | 1.0 | |
| maladaptive-biased injury-front / pre-FR Inj-PT | 3 | -0.355 | 0.692 | 0.360 | 1.0 |
[16]:
from pathlib import Path
from PIL import Image, ImageOps
from IPython.display import display

ROOT = Path.cwd()
if ROOT.name != "RealData_MouseKidneyXenium":
    ROOT = Path("/home/byual/stGP-0707/RealData_MouseKidneyXenium")
os.chdir(ROOT)
left_path = ROOT / "Figures" / "Inj_PT_L" / "pseudotime_Day2L" / "Day2L_slingshot_arrow_overlay.png"
right_path = ROOT / "Figures" / "Inj_PT_R" / "pseudotime_Day2R" / "Day2R_slingshot_arrow_overlay.png"
reference_path = ROOT / "Figures" / "Immune_R" / "Day14_L-stGP2_R-stGP3.png"
out_path = ROOT / "Figures" / "Inj_PT_R" / "pseudotime_Day2R" / "Day2L_Day2R_slingshot_arrow_overlay_combined.png"

with Image.open(reference_path) as ref:
    target_w, target_h = ref.size

panel_widths = [target_w // 2, target_w - target_w // 2]
canvas = Image.new("RGB", (target_w, target_h), "white")

for x0, panel_w, image_path in zip([0, panel_widths[0]], panel_widths, [left_path, right_path]):
    with Image.open(image_path) as img:
        img = img.convert("RGB")
        panel = Image.new("RGB", (panel_w, target_h), "white")
        resized = ImageOps.contain(img, (panel_w, target_h), method=Image.Resampling.LANCZOS)
        offset = ((panel_w - resized.width) // 2, (target_h - resized.height) // 2)
        panel.paste(resized, offset)
        canvas.paste(panel, (x0, 0))

canvas = ImageOps.flip(canvas)
canvas.save(out_path, dpi=(400, 400))
print(f"Saved: {out_path}")
print(f"Output size: {canvas.size}; reference size: {(target_w, target_h)}")
display(canvas)
Saved: /import/home4/byual/stGP-0707/RealData_MouseKidneyXenium/Figures/Inj_PT_R/pseudotime_Day2R/Day2L_Day2R_slingshot_arrow_overlay_combined.png
Output size: (1935, 1495); reference size: (1935, 1495)
[ ]:
7. Fig6 pseudotime combined panel
Display the combined Day2L/Day2R Slingshot arrow overlay generated above.
[17]:
from IPython.display import Image, display

combined_path = ROOT / "Figures" / "Inj_PT_R" / "pseudotime_Day2R" / "Day2L_Day2R_slingshot_arrow_overlay_combined.png"
fig6_path = ROOT / "Figures" / "Inj_PT_R" / "pseudotime_Day2R" / "kidney_Day2L_Day2R_slingshot_arrow_overlay_combined.png"
if combined_path.exists():
    fig6_path.write_bytes(combined_path.read_bytes())
    print(fig6_path)
    display(Image(filename=str(fig6_path)))
else:
    print(f"Combined pseudotime panel not found: {combined_path}")
/import/home4/byual/stGP-0707/RealData_MouseKidneyXenium/Figures/Inj_PT_R/pseudotime_Day2R/kidney_Day2L_Day2R_slingshot_arrow_overlay_combined.png
